E15.5 Analysis
Paul Hook
Last update: 2018-01-18
Code version: 5996c19850dc5fc65723f30bc33ab1c8d083a7e6
Setting important directories. Also loading important libraries and custom functions for analysis.
seq_dir <- "/Volumes/PAULHOOK/sc-da-parkinsons/data"
file_dir <- "/Volumes/PAULHOOK/sc-da-parkinsons/output"
Rdata_dir <- "/Volumes/PAULHOOK/sc-da-parkinsons/data"
Script_dir <- "/Volumes/PAULHOOK/sc-da-parkinsons/code"
source(file.path(Script_dir,'init.R'))
source(file.path(Script_dir,"tools_R.r"))
Loading the E15.5 all cell .rds
e15.dat.filter <- readRDS(file = file.path(Rdata_dir, "e15.dat.filter.final.Rds"))
nrow(pData(e15.dat.filter)) # 172
## [1] 172Performing differentially expression
e15.Diff.Test <- differentialGeneTest(e15.dat.filter,
                             fullModelFormulaStr = "~subset.cluster",
                             reducedModelFormulaStr = "~1",
                             relative_expr = FALSE,
                             cores=8,
                             verbose = F)


nrow(e15.Diff.Test)
## [1] 14409# Only keeping differentially expressed genes with a FDF < 5%
e15.tmp<-e15.Diff.Test[e15.Diff.Test$qval < 0.05,]
# Ordering by q-value
e15.tmp.2 <- e15.tmp[order(e15.tmp$qval),]
e15.Diff.Genes <- as.character(e15.tmp.2$gene_short_name)
length(e15.Diff.Genes) # 1196## [1] 1196t-SNE plots of top 10 differentially expressed genes
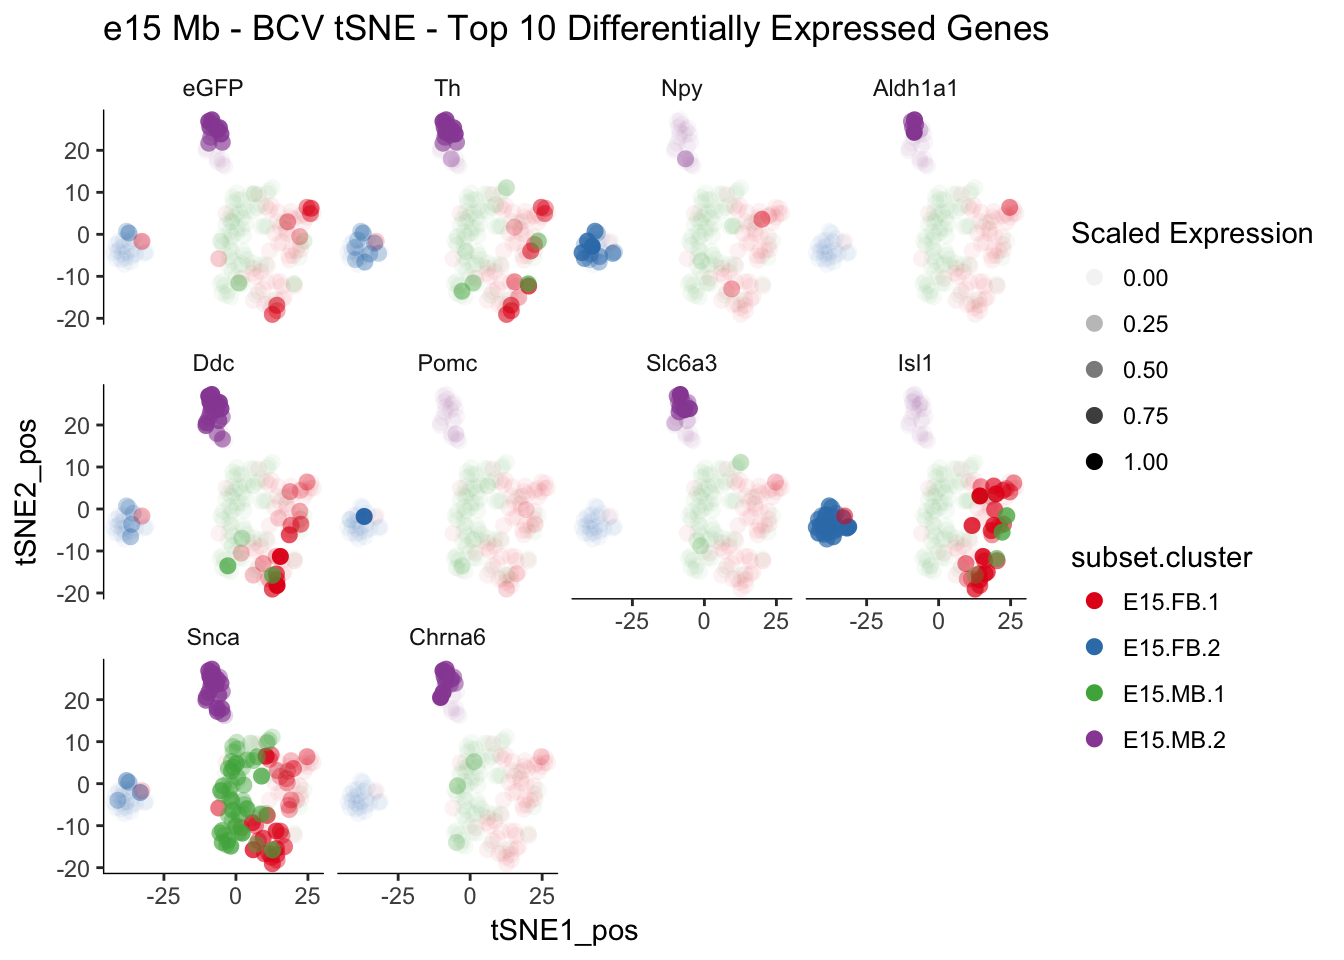
q <-myTSNEPlotAlpha(e15.dat.filter,color="subset.cluster", shape="age",markers = e15.Diff.Genes[1:10],scaled = T) + scale_color_brewer(palette="Set1") + ggtitle("e15 Mb - BCV tSNE - Top 10 Differentially Expressed Genes")## Scale for 'colour' is already present. Adding another scale for
## 'colour', which will replace the existing scale.q
Finding specific genes for each cluster
e15.dat.diff.filter <- e15.dat.filter[row.names(e15.tmp.2),]
nrow(e15.dat.diff.filter)
## Features
## 1196subset.clusters <- levels(pData(e15.dat.diff.filter)$subset.cluster)
mean.clusters <- data.frame(rownames(exprs(e15.dat.diff.filter)))
percent.clusters <- data.frame(rownames(exprs(e15.dat.diff.filter)))
for(i in 1:length(subset.clusters)){
tmp.dat <- e15.dat.diff.filter[,pData(e15.dat.diff.filter)$subset.cluster == subset.clusters[i]]
per.tmp<-as.data.frame(apply(exprs(tmp.dat),1, function(x) length(which(x > 1))/ncol(tmp.dat)))
colnames(per.tmp) <- paste0(subset.clusters[i],".perc")
mean.tmp<- as.data.frame(apply(log2(exprs(tmp.dat)+1),1,mean))
mean.tmp <- as.data.frame(mean.tmp)
colnames(mean.tmp) <- paste0(subset.clusters[i],".mean")
mean.clusters <- merge(x = mean.clusters, y = mean.tmp, by.x = "rownames.exprs.e15.dat.diff.filter..", by.y = 0)
percent.clusters <- merge(x = percent.clusters, y = per.tmp, by.x = "rownames.exprs.e15.dat.diff.filter..", by.y = 0)
}
rownames(mean.clusters) <- mean.clusters$rownames.exprs.e15.dat.diff.filter..
mean.clusters <- mean.clusters[,-1]
mean.clusters <- as.matrix(mean.clusters)
dat.JSD <- .specificity(mat = mean.clusters,logMode = F, relative = F)
dat.JSD <- as.data.frame(dat.JSD)
rownames(percent.clusters) <- percent.clusters$rownames.exprs.e15.dat.diff.filter..
percent.clusters <- percent.clusters[,-1]
merged.df <- merge(x = dat.JSD, y = percent.clusters, by = 0)
row.names(merged.df) <- merged.df$Row.names
merged.df <- merged.df[,-1]color <- c("#F6937A","#882F1C","#BF1F36","#C2B280")
color.transparent <- adjustcolor(color, alpha.f = 0.3)
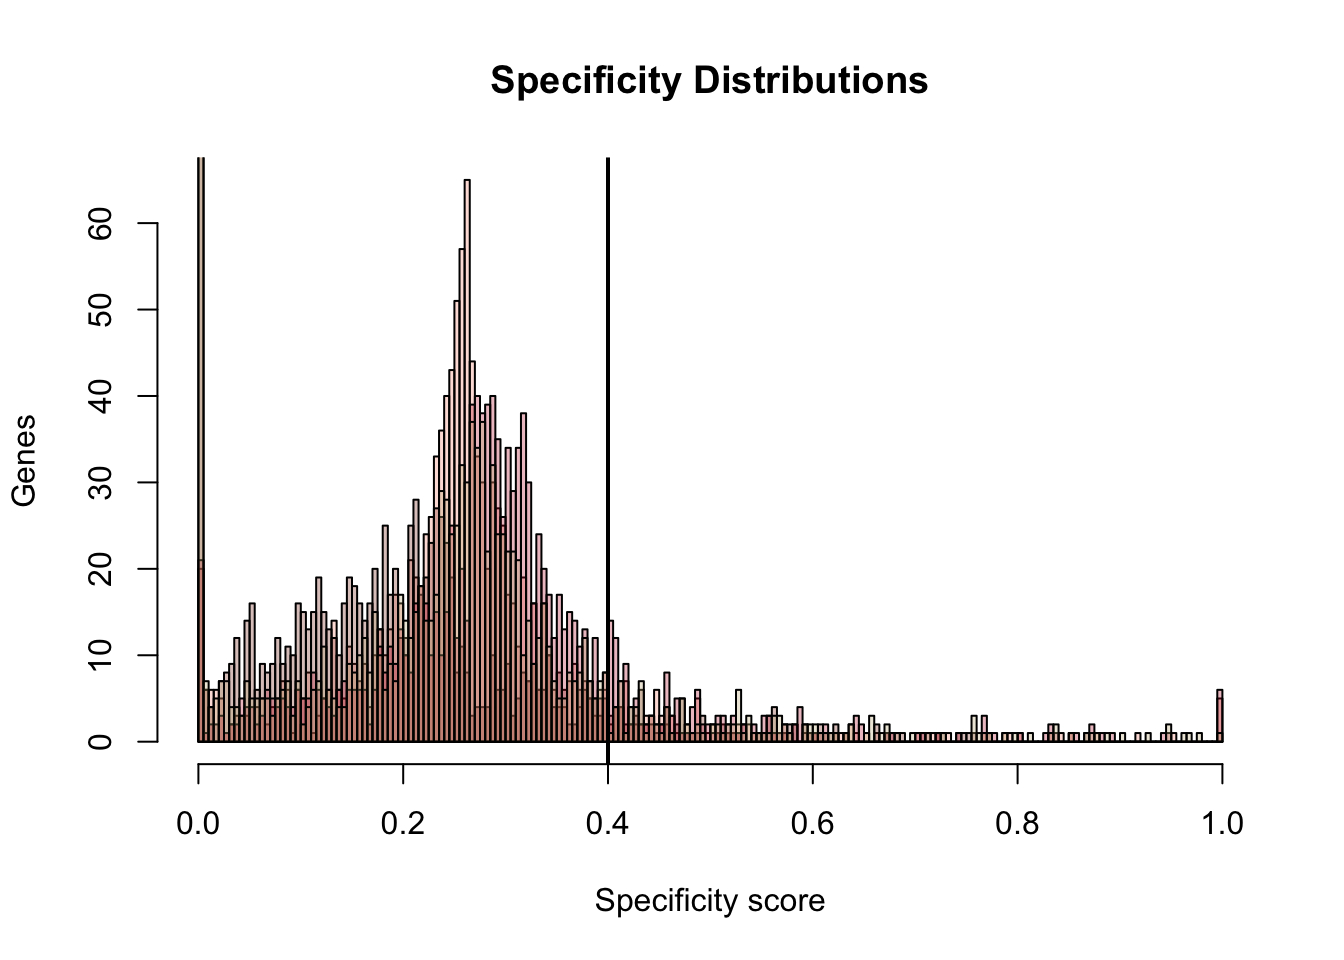
bins <- seq(from = 0, to = 1, by= 0.005)
hist(dat.JSD$E15.FB.1.mean, breaks = bins, col = color.transparent[1], main = "Specificity Distributions", ylab = "Genes", xlab = "Specificity score")
hist(dat.JSD$E15.FB.2.mean, breaks = bins, add = T, col = color.transparent[2])
hist(dat.JSD$E15.MB.1.mean, breaks = bins, add = T, col = color.transparent[3])
hist(dat.JSD$E15.MB.2.mean, breaks = bins, add = T, col = color.transparent[4])
abline(v = 0.4, lwd = 2)
e15.specific.genes <- data.frame()

for(i in 1:4){
  gene.tmp.1 <- merged.df[merged.df[,i] >= 0.4 & merged.df[,i+4] >= 0.4,]
  gene.ordered <- row.names(gene.tmp.1[order(-gene.tmp.1[,i]),])
  cluster.genes <- data.frame(lookupGeneName(e15.dat.filter, gene.ordered))
  e15.specific.genes <- cbindPad(e15.specific.genes, cluster.genes)
}

names(e15.specific.genes) <- c("E15.FB.1","E15.FB.2","E15.MB.1","E15.MB.2")

write.table(e15.specific.genes, file = file.path(file_dir,"E15.specific.genes.txt"), sep = "\t", quote = F, row.names = F)
Making an interactive table for specific genes
library(DT)
datatable(e15.specific.genes)
## Warning in instance$preRenderHook(instance): It seems your data is too
## big for client-side DataTables. You may consider server-side processing:
## http://rstudio.github.io/DT/server.htmlsessionInfo()## R version 3.3.0 (2016-05-03)
## Platform: x86_64-apple-darwin13.4.0 (64-bit)
## Running under: OS X 10.11.6 (El Capitan)
##
## locale:
## [1] en_US.UTF-8/en_US.UTF-8/en_US.UTF-8/C/en_US.UTF-8/en_US.UTF-8
##
## attached base packages:
## [1] grid splines stats4 parallel stats graphics grDevices
## [8] utils datasets methods base
##
## other attached packages:
## [1] DT_0.2 ggbiplot_0.55 scales_0.5.0
## [4] SC3_1.1.4 ROCR_1.0-7 jackstraw_1.1.1
## [7] lfa_1.2.2 tsne_0.1-3 gridExtra_2.3
## [10] slackr_1.4.2 vegan_2.4-4 permute_0.9-4
## [13] MASS_7.3-47 gplots_3.0.1 RColorBrewer_1.1-2
## [16] Hmisc_4.0-3 Formula_1.2-2 survival_2.41-3
## [19] lattice_0.20-35 Heatplus_2.18.0 Rtsne_0.13
## [22] pheatmap_1.0.8 tidyr_0.7.1 dplyr_0.7.4
## [25] plyr_1.8.4 heatmap.plus_1.3 stringr_1.2.0
## [28] marray_1.50.0 limma_3.28.21 reshape2_1.4.3
## [31] monocle_2.2.0 DDRTree_0.1.5 irlba_2.2.1
## [34] VGAM_1.0-2 ggplot2_2.2.1 Biobase_2.32.0
## [37] BiocGenerics_0.18.0 Matrix_1.2-11
##
## loaded via a namespace (and not attached):
## [1] RSelenium_1.7.1 colorspace_1.3-2 class_7.3-14
## [4] rprojroot_1.2 htmlTable_1.9 corpcor_1.6.9
## [7] base64enc_0.1-3 mvtnorm_1.0-6 codetools_0.2-15
## [10] doParallel_1.0.11 robustbase_0.92-7 knitr_1.17
## [13] jsonlite_1.5 cluster_2.0.6 semver_0.2.0
## [16] shiny_1.0.5 rrcov_1.4-3 httr_1.3.1
## [19] backports_1.1.1 assertthat_0.2.0 lazyeval_0.2.1
## [22] acepack_1.4.1 htmltools_0.3.6 tools_3.3.0
## [25] bindrcpp_0.2 igraph_1.1.2 gtable_0.2.0
## [28] glue_1.1.1 binman_0.1.0 doRNG_1.6.6
## [31] Rcpp_0.12.14 slam_0.1-37 gdata_2.18.0
## [34] nlme_3.1-131 iterators_1.0.8 mime_0.5
## [37] rngtools_1.2.4 gtools_3.5.0 WriteXLS_4.0.0
## [40] XML_3.98-1.9 DEoptimR_1.0-8 yaml_2.1.15
## [43] pkgmaker_0.22 rpart_4.1-11 fastICA_1.2-1
## [46] latticeExtra_0.6-28 stringi_1.1.5 pcaPP_1.9-72
## [49] foreach_1.4.3 e1071_1.6-8 checkmate_1.8.4
## [52] caTools_1.17.1 rlang_0.1.6 pkgconfig_2.0.1
## [55] matrixStats_0.52.2 bitops_1.0-6 qlcMatrix_0.9.5
## [58] evaluate_0.10.1 purrr_0.2.4 bindr_0.1
## [61] labeling_0.3 htmlwidgets_0.9 magrittr_1.5
## [64] R6_2.2.2 combinat_0.0-8 wdman_0.2.2
## [67] foreign_0.8-69 mgcv_1.8-22 nnet_7.3-12
## [70] tibble_1.3.4 KernSmooth_2.23-15 rmarkdown_1.8
## [73] data.table_1.10.4 HSMMSingleCell_0.106.2 digest_0.6.12
## [76] xtable_1.8-2 httpuv_1.3.5 openssl_0.9.7
## [79] munsell_0.4.3 registry_0.3This R Markdown site was created with workflowr