P7 FB Recursive Analysis
Paul Hook
Last update: 2018-01-18
Code version: 5996c19850dc5fc65723f30bc33ab1c8d083a7e6
Setting important directories
Also loading important libraries and custom functions for analysis.
seq_dir <- "/Volumes/PAULHOOK/sc-da-parkinsons/data"
file_dir <- "/Volumes/PAULHOOK/sc-da-parkinsons/output"
Rdata_dir <- "/Volumes/PAULHOOK/sc-da-parkinsons/data"
Script_dir <- "/Volumes/PAULHOOK/sc-da-parkinsons/code"
source(file.path(Script_dir,'init.R'))
source(file.path(Script_dir,"tools_R.r"))
Loading FB .rds
P7.Fb.dat.filter <- readRDS(file = file.path(Rdata_dir, "P7.Fb.dat.filter.rds"))Filter genes by percentage of cells expresssing each gene
# Plot number of cells expressing each gene as histogram
hist(fData(P7.Fb.dat.filter)$num_cells_expressed,breaks=100,col="red",main="Cells expressed per gene")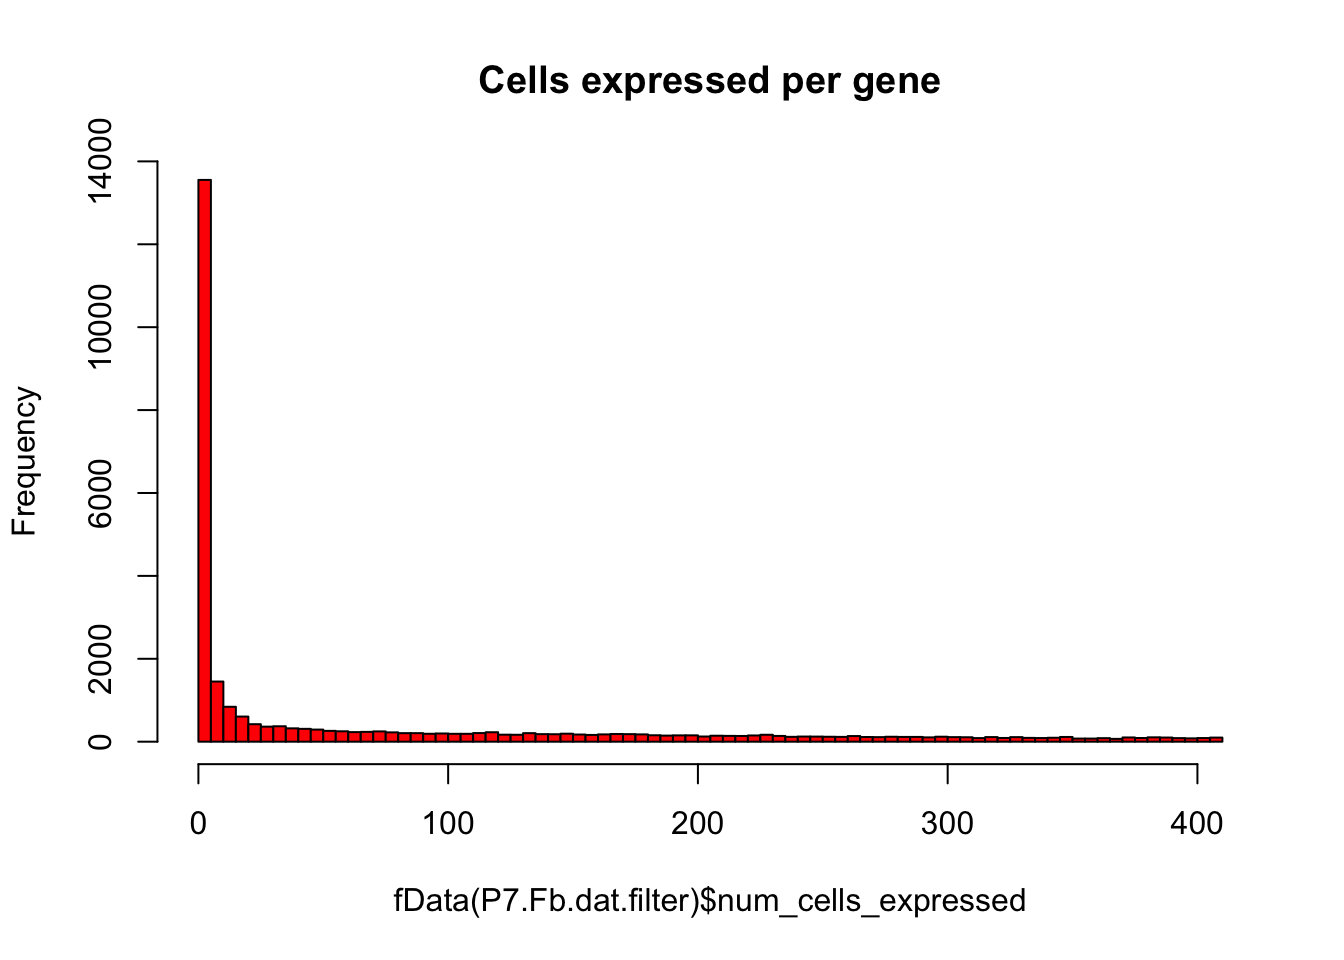
# Keep only expressed genes with expression in >= 5% of cells
numCellThreshold<-nrow(pData(P7.Fb.dat.filter))*0.05
P7.Fb.dat.expressed_genes<-row.names(subset(fData(P7.Fb.dat.filter),num_cells_expressed >= numCellThreshold))

# Same plot as above with threshold
hist(fData(P7.Fb.dat.filter)$num_cells_expressed,breaks=100,col="red",main="Cells expressed per gene - threshold")
abline(v=numCellThreshold,lty="dashed")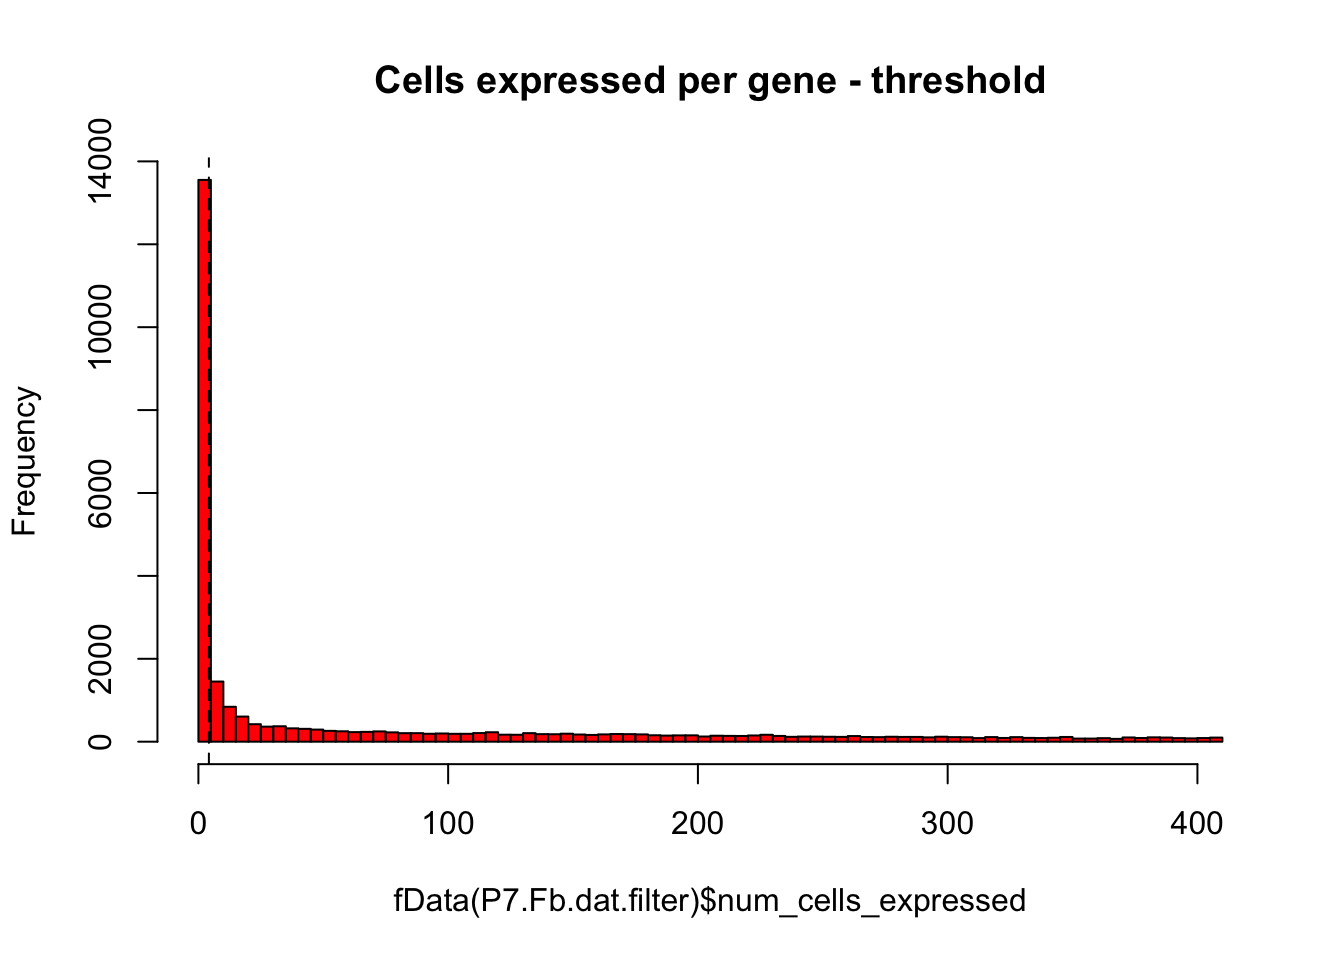
Prepping the Monocle model for analysis
# Only keeping "expressed" genes
P7.Fb.dat.filter <-P7.Fb.dat.filter[P7.Fb.dat.expressed_genes,]

# Estimating the size factors
P7.Fb.dat.filter <-estimateSizeFactors(P7.Fb.dat.filter)

# Estimating dispersions
P7.Fb.dat.filter <- estimateDispersions(P7.Fb.dat.filter,cores=8)
## Warning: Deprecated, use tibble::rownames_to_column() instead.## Removing 170 outliers# Removing 170 outliers
# Warning message:
# Deprecated, use tibble::rownames_to_column() instead. Calculating summary stats
# Calculating summary stats
fData(P7.Fb.dat.filter)$mean_expr<-apply(round(exprs(P7.Fb.dat.filter)),1,mean) # mean expression
fData(P7.Fb.dat.filter)$sd_expr<-apply(round(exprs(P7.Fb.dat.filter)),1,sd) # sd expression
fData(P7.Fb.dat.filter)$bcv<-(fData(P7.Fb.dat.filter)$sd_expr/fData(P7.Fb.dat.filter)$mean_expr)**2 # calculating biological coefficient of variation
fData(P7.Fb.dat.filter)$percent_detection<-(fData(P7.Fb.dat.filter)$num_cells_expressed/dim(P7.Fb.dat.filter)[2])*100 # calculating % detection
Identifying high dispersion genes
P7.Fb.dat.filter.genes <- P7.Fb.dat.filter # spoofing the CellDataSet
disp_table <- dispersionTable(P7.Fb.dat.filter.genes) # pulling out the dispersion table
unsup_clustering_genes <-subset(disp_table, mean_expression >= 0.5 & dispersion_empirical >= 1.5 * dispersion_fit) # subsetting the data to pull out genes with expression above 0.5 and dispersion empirical > 2
P7.Fb.dat.high_bcv_genes<-unsup_clustering_genes$gene_id # pulling out list of genes
P7.Fb.dat.filter.order <- setOrderingFilter(P7.Fb.dat.filter, unsup_clustering_genes$gene_id)
plot_ordering_genes(P7.Fb.dat.filter.order) # plotting the dispersion and genes
## Warning: Transformation introduced infinite values in continuous y-axis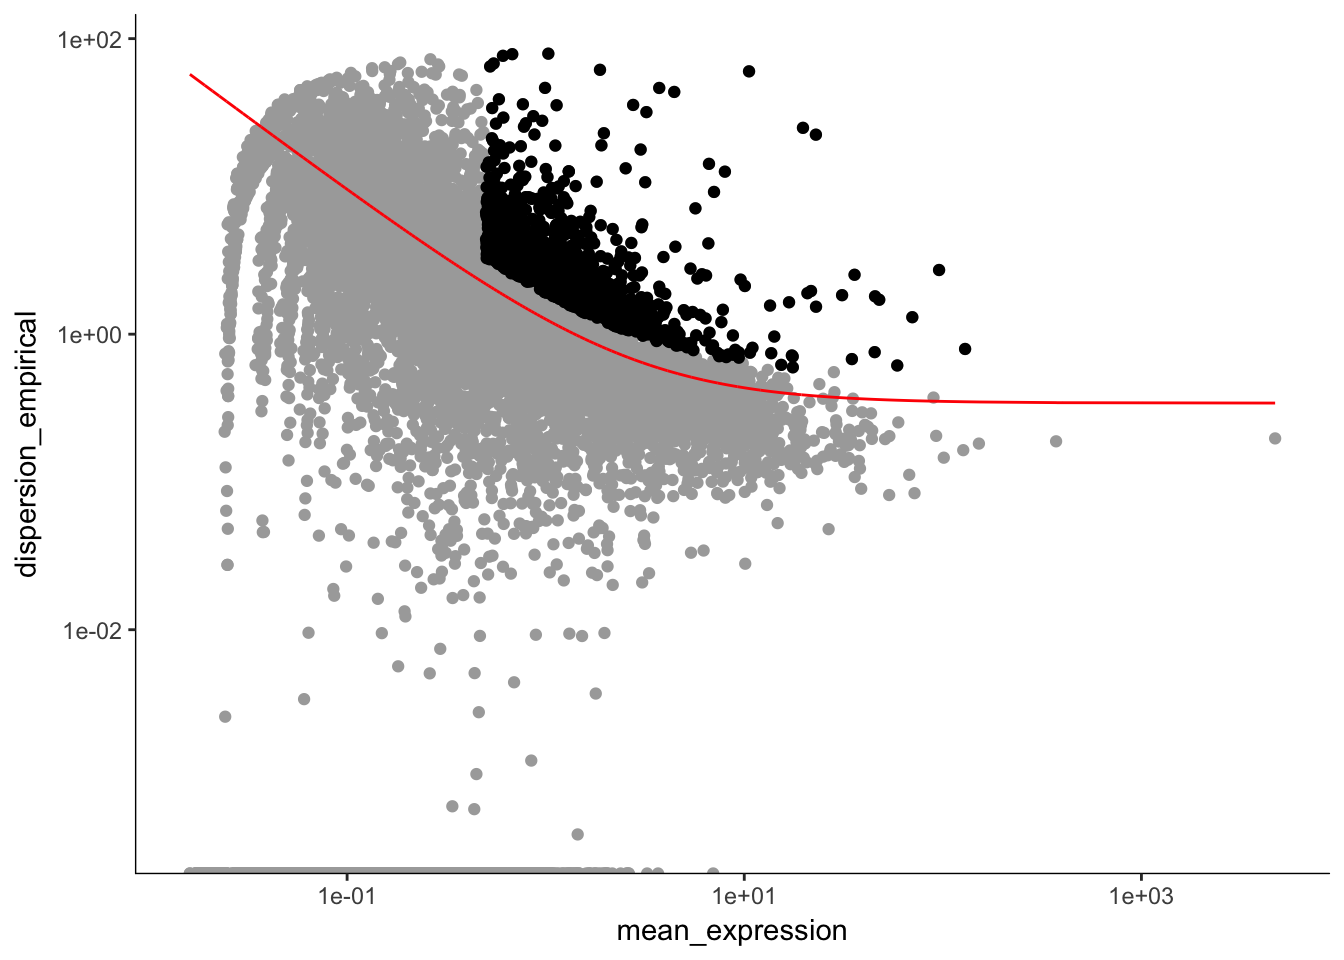
length(P7.Fb.dat.high_bcv_genes) # 1087## [1] 1087Running PCA with high dispersion genes
# BCV Identified high dispersion genes. Running PC analysis
P7.Fb.dat.filter.BCV.pca<-prcomp(t(log2(exprs(P7.Fb.dat.filter[P7.Fb.dat.high_bcv_genes,])+1)),center=T,scale. = TRUE)

# Plotting the PCA graphs
# Plotting the first 2 PCs and coloring by age
hvPCA1<-ggbiplot(P7.Fb.dat.filter.BCV.pca,choices=c(1,2),scale=0,groups=pData(P7.Fb.dat.filter)$age,ellipse=F,var.axes=F) + scale_color_manual(values=c("darkgreen","red")) + monocle:::monocle_theme_opts()

# Plotting the first 2 PCs and coloring by region
hvPCA2<-ggbiplot(P7.Fb.dat.filter.BCV.pca,choices=c(1,2),scale=0,groups=pData(P7.Fb.dat.filter)$region,ellipse=F,var.axes=F) + scale_color_brewer(palette="Set1") + monocle:::monocle_theme_opts() + ggtitle("P7 FB PCA")

# Plotting the first 2 PCs and coloring by plate the cell was sequenced from
hvPCA3<-ggbiplot(P7.Fb.dat.filter.BCV.pca,choices=c(1,2),scale=0,groups=pData(P7.Fb.dat.filter)$split_plate,ellipse=F,var.axes=F) + scale_color_brewer(palette="Set1") + monocle:::monocle_theme_opts()

# Show the plots in the terminal
hvPCA1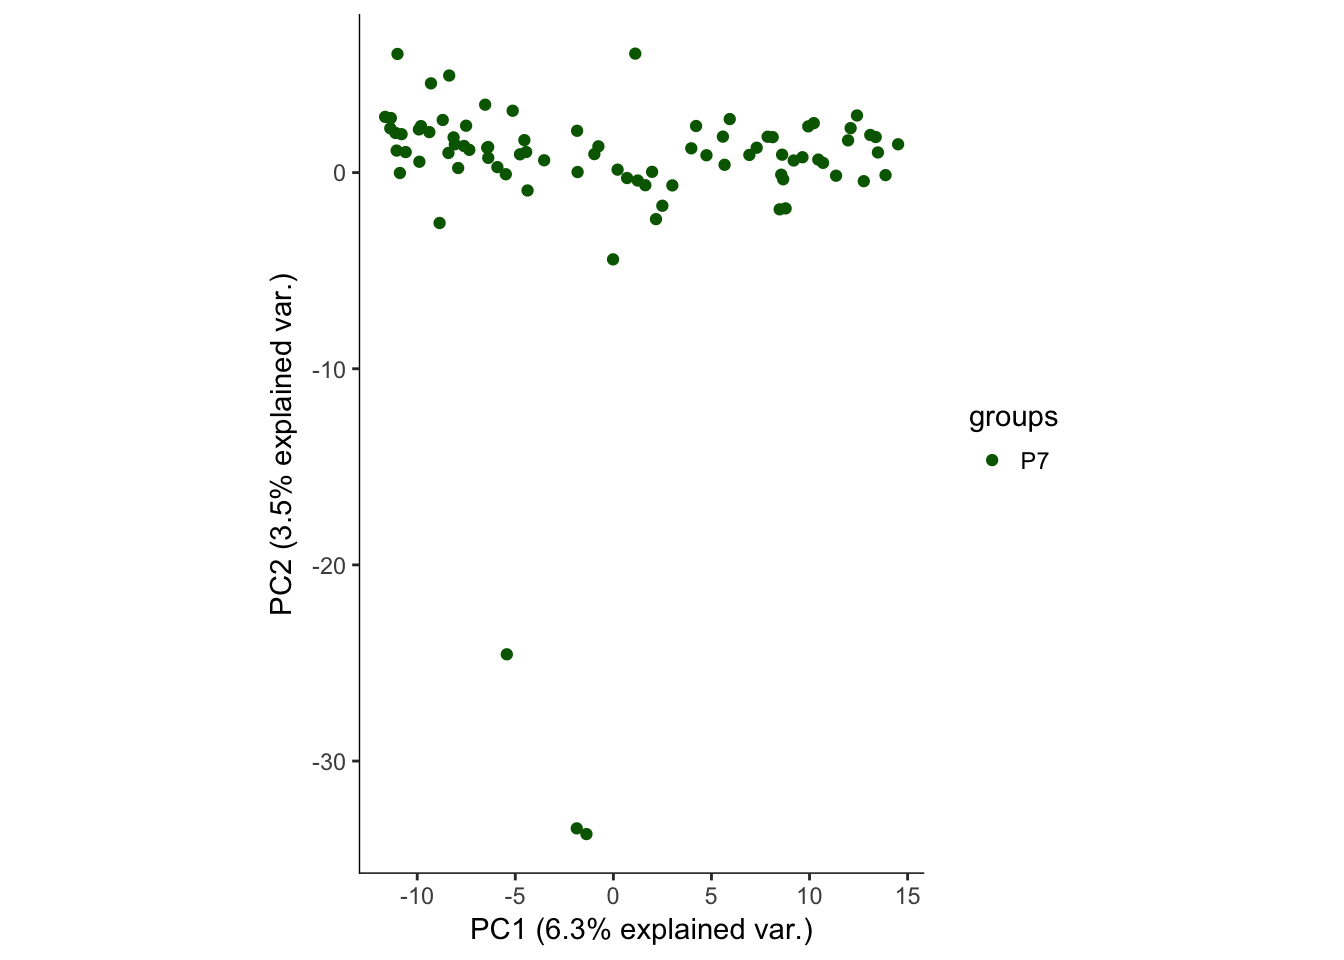
hvPCA2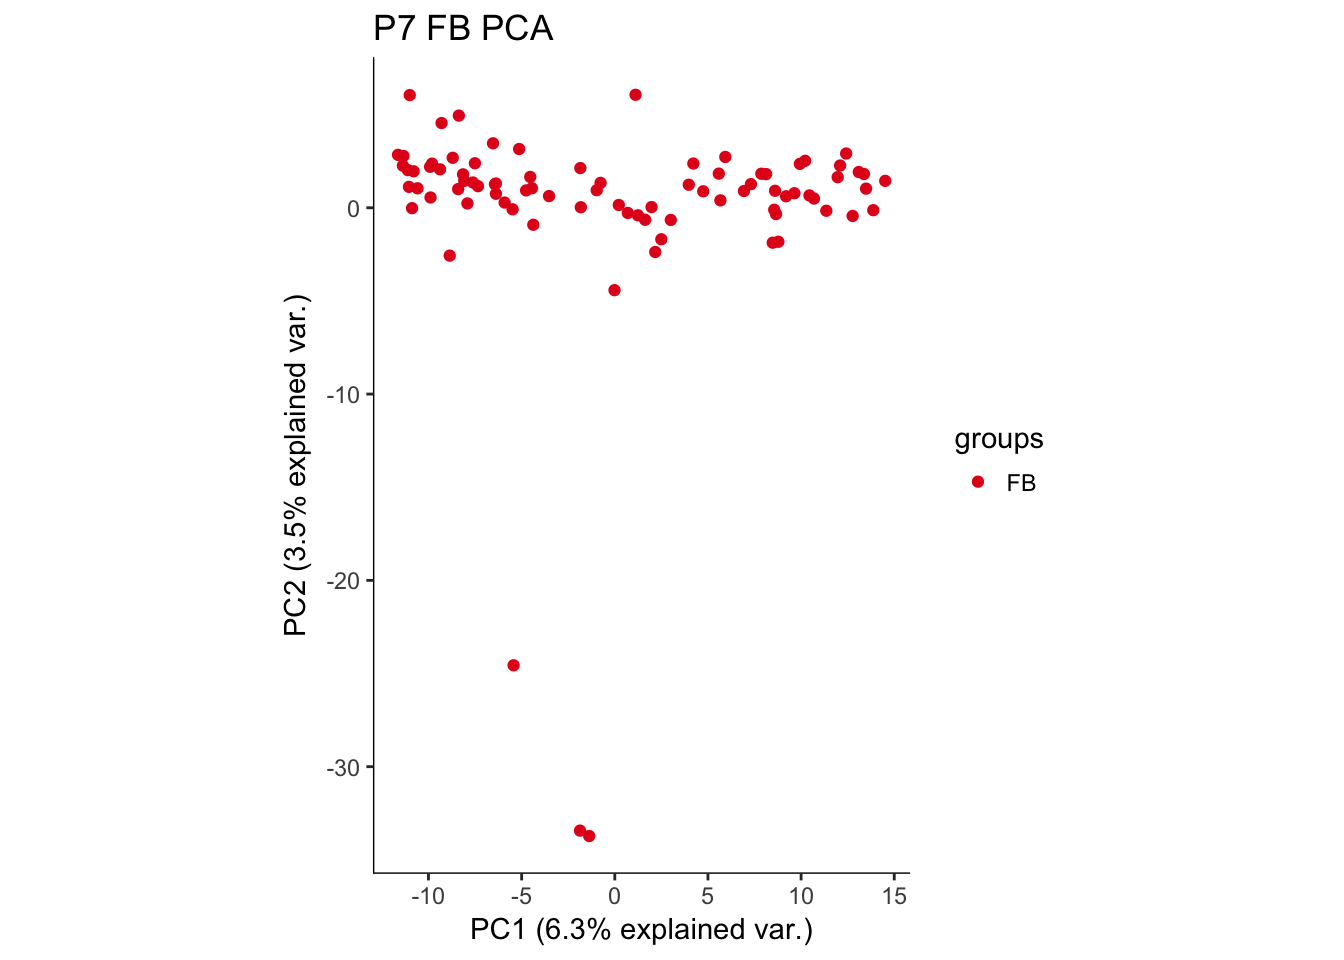
hvPCA3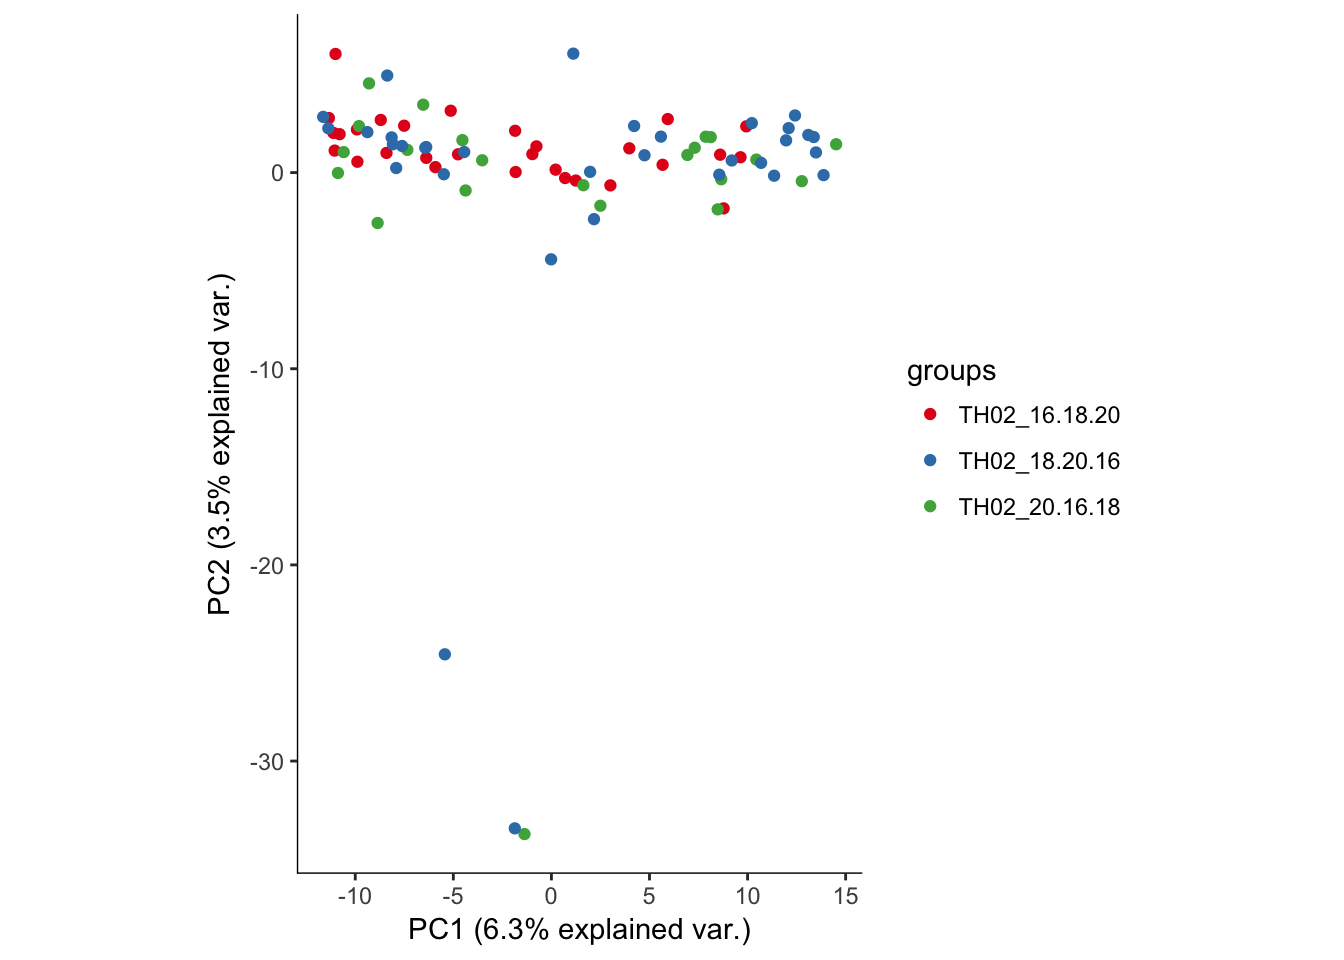
Outlier indentification
The first pass analysis seems to show obvious outliers in the PCA. Below, the relevant data is saved to look at outliers in the future
FB.outlier.plot <- ggbiplot(P7.Fb.dat.filter.BCV.pca,choices=c(1,2),scale=0,groups=pData(P7.Fb.dat.filter)$region,ellipse=F,var.axes=F)

saveRDS(P7.Fb.dat.filter.BCV.pca, file = file.path(Rdata_dir,"P7.FB.PCA.outlier.pca.rds"))
saveRDS(FB.outlier.plot, file = file.path(Rdata_dir,"P7.FB.PCA.outliers.rds"))
Outlier analysis
In an attempt to identify what the outliers are, genes driving the outlier appearance are extracted and saved for GSEA analysis
# PC1 seems to describe outliers in the data
P7.FB.dat.pca.rotations.df <- as.data.frame(P7.Fb.dat.filter.BCV.pca$rotation[,1:6])
genes.tmp <- P7.FB.dat.pca.rotations.df[order(-P7.FB.dat.pca.rotations.df$PC2),]
PC2.genes <- as.character(row.names(genes.tmp))
PC2.genes.names <- lookupGeneName(P7.Fb.dat.filter,PC2.genes)
genes.tmp$gene_short_name <- PC2.genes.names

PC2.genes.df <- genes.tmp[,c(7,2)]
write.table(PC2.genes.df, file = file.path(file_dir, "P7.Fb.cells.PC2.rnk"),quote = F, sep = '\t', row.names = F, col.names = F)
Removing outliers from the original OB dataset
pData(P7.Fb.dat.filter)$PC1 <- P7.Fb.dat.filter.BCV.pca$x[,1]
pData(P7.Fb.dat.filter)$PC2 <- P7.Fb.dat.filter.BCV.pca$x[,2]
P7.Fb.dat.outliers.1<-as.character(pData(P7.Fb.dat.filter[,pData(P7.Fb.dat.filter)$PC2 <= -20])$sample_id.x)
length(P7.Fb.dat.outliers.1)
## [1] 3P7.Fb.dat.filter <- readRDS(file = file.path(Rdata_dir, "P7.Fb.dat.filter.rds"))
nrow(pData(P7.Fb.dat.filter)) # 84## [1] 84P7.Fb.dat.filter <- P7.Fb.dat.filter[,!(pData(P7.Fb.dat.filter)$sample_id.x %in% P7.Fb.dat.outliers.1)]
saveRDS(object = P7.Fb.dat.outliers.1, file = file.path(Rdata_dir,"P7.Fb.outliers.rds"))Rerunning analysis on P7 FB with outliers removed.
Starting here, all work performed above was re-run with the outliers removed.
Filter genes by percentage of cells expresssing each gene with outliers removed
# Plot number of cells expressing each gene as histogram
hist(fData(P7.Fb.dat.filter)$num_cells_expressed,breaks=100,col="red",main="Cells expressed per gene")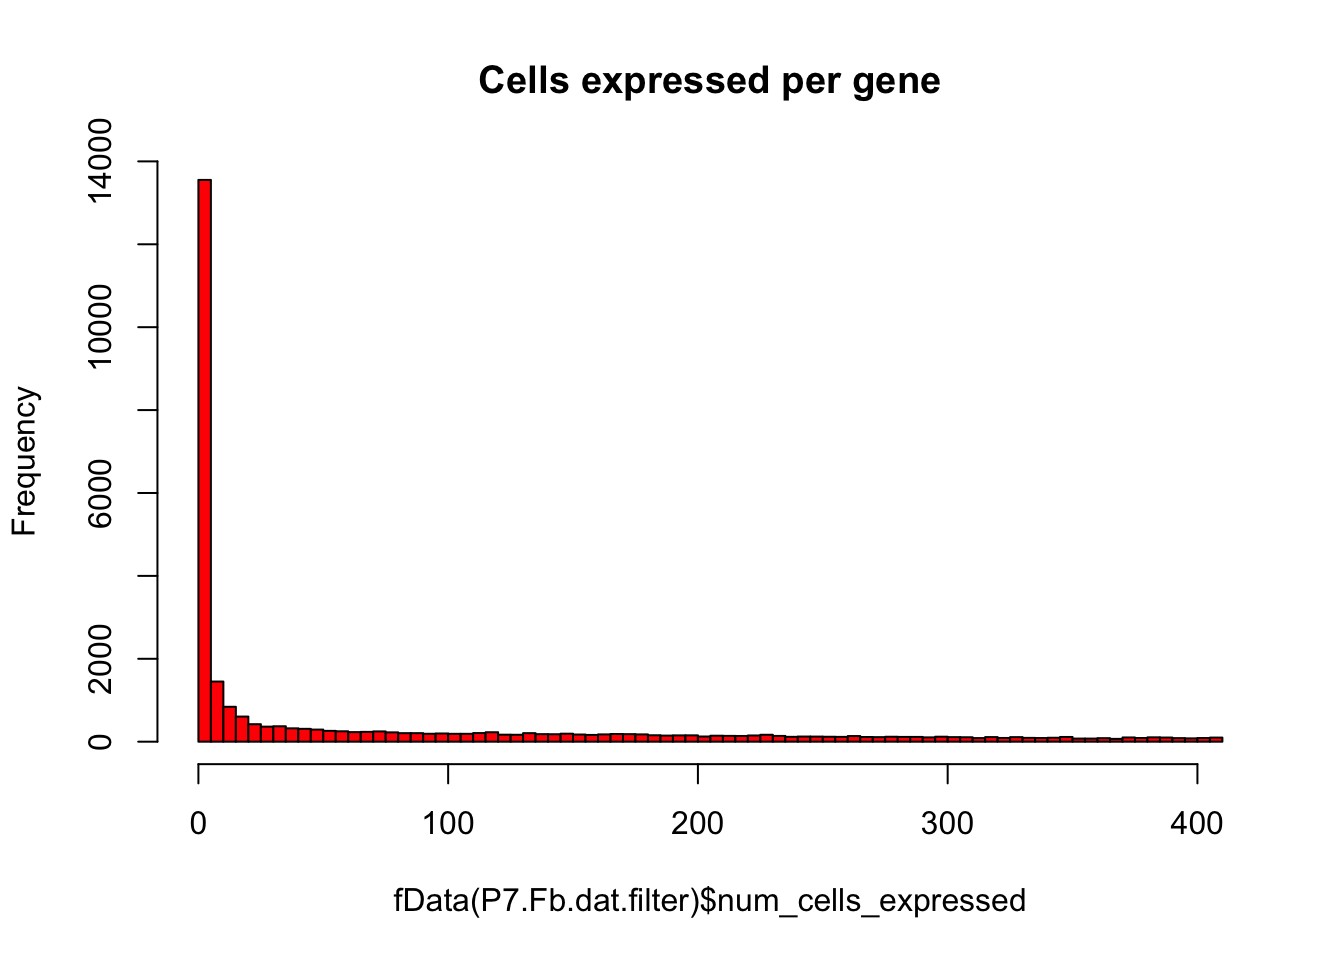
# Keep only expressed genes with expression in >= 5% of cells
numCellThreshold<-nrow(pData(P7.Fb.dat.filter))*0.05
P7.Fb.dat.expressed_genes<-row.names(subset(fData(P7.Fb.dat.filter),num_cells_expressed >= numCellThreshold))

# Same plot as above with threshold
hist(fData(P7.Fb.dat.filter)$num_cells_expressed,breaks=100,col="red",main="Cells expressed per gene - threshold")
abline(v=numCellThreshold,lty="dashed")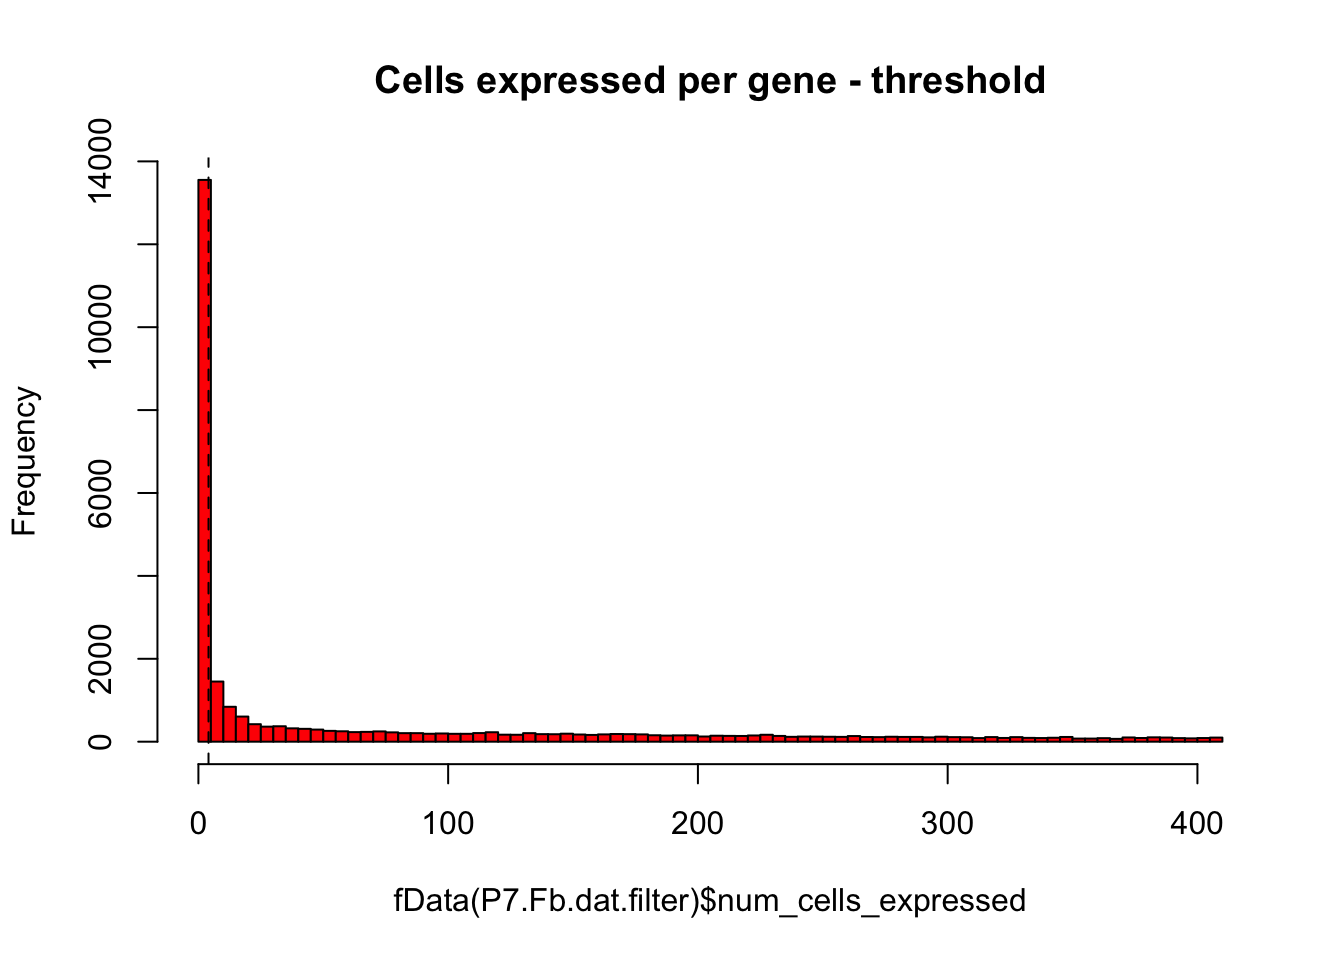
Prepping the Monocle model for analysis with outliers removed
# Only keeping "expressed" genes
P7.Fb.dat.filter <-P7.Fb.dat.filter[P7.Fb.dat.expressed_genes,]

# Estimating the size factors
P7.Fb.dat.filter <-estimateSizeFactors(P7.Fb.dat.filter)

# Estimating dispersions
P7.Fb.dat.filter <- estimateDispersions(P7.Fb.dat.filter,cores=8)
## Warning: Deprecated, use tibble::rownames_to_column() instead.## Removing 192 outliers# Removing 192 outliers
# Warning message:
# Deprecated, use tibble::rownames_to_column() instead. Calculating summary stats with outliers removed
# Calculating summary stats
fData(P7.Fb.dat.filter)$mean_expr<-apply(round(exprs(P7.Fb.dat.filter)),1,mean) # mean expression
fData(P7.Fb.dat.filter)$sd_expr<-apply(round(exprs(P7.Fb.dat.filter)),1,sd) # sd expression
fData(P7.Fb.dat.filter)$bcv<-(fData(P7.Fb.dat.filter)$sd_expr/fData(P7.Fb.dat.filter)$mean_expr)**2 # calculating biological coefficient of variation
fData(P7.Fb.dat.filter)$percent_detection<-(fData(P7.Fb.dat.filter)$num_cells_expressed/dim(P7.Fb.dat.filter)[2])*100 # calculating % detection
Identifying high dispersion genes with outliers removed
P7.Fb.dat.filter.genes <- P7.Fb.dat.filter # spoofing the CellDataSet
disp_table <- dispersionTable(P7.Fb.dat.filter.genes) # pulling out the dispersion table
unsup_clustering_genes <-subset(disp_table, mean_expression >= 0.5 & dispersion_empirical >= 1.5 * dispersion_fit) # subsetting the data to pull out genes with expression above 0.5 and dispersion empirical > 2
P7.Fb.dat.high_bcv_genes<-unsup_clustering_genes$gene_id # pulling out list of genes
P7.Fb.dat.filter.order <- setOrderingFilter(P7.Fb.dat.filter, unsup_clustering_genes$gene_id)
plot_ordering_genes(P7.Fb.dat.filter.order) # plotting the dispersion and genes
## Warning: Transformation introduced infinite values in continuous y-axis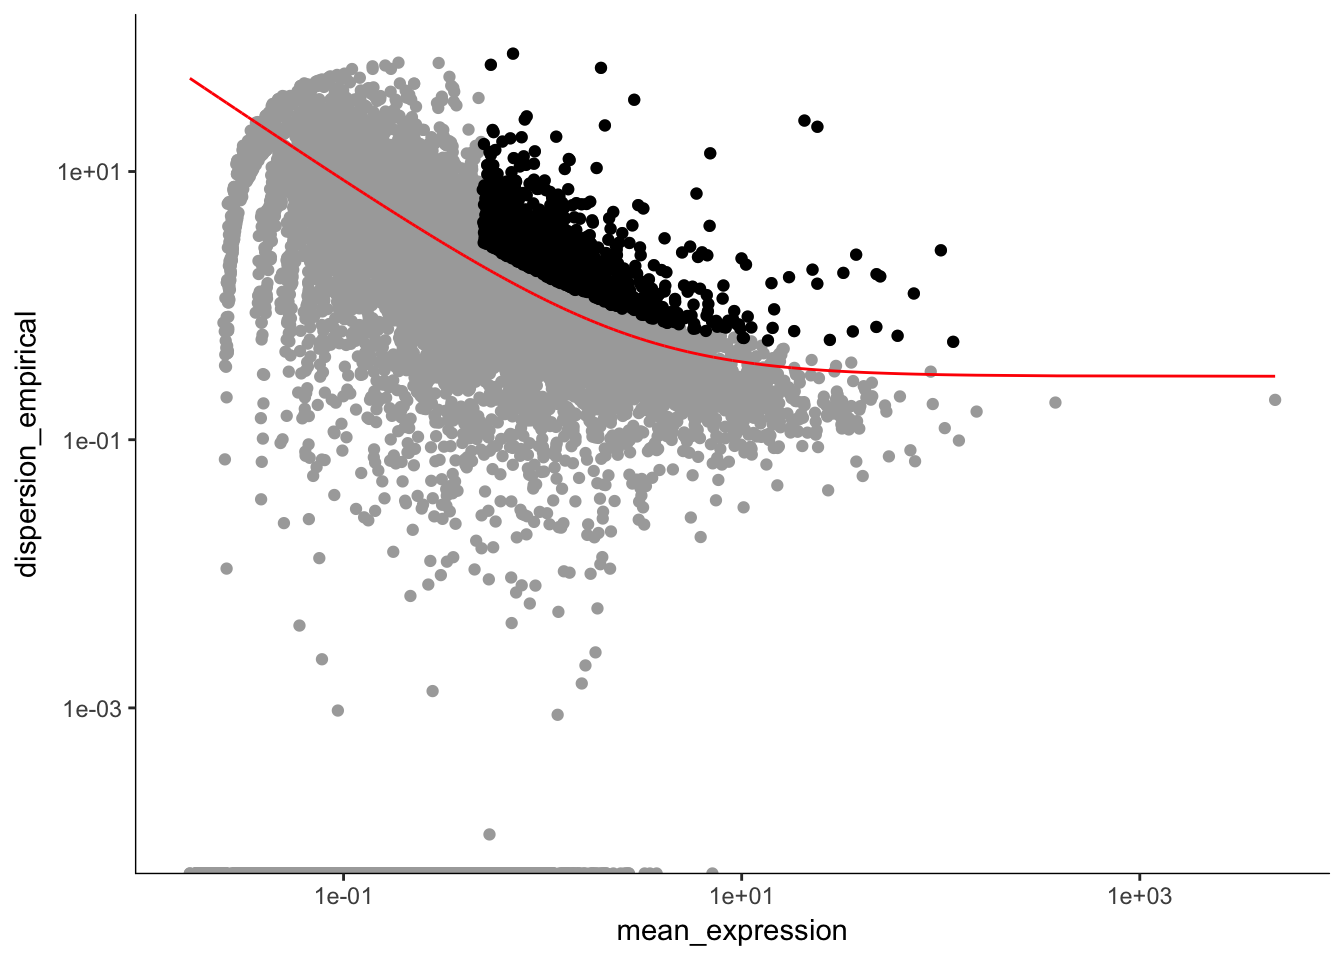
length(P7.Fb.dat.high_bcv_genes) # 1172## [1] 1172Running PCA with high dispersion genes with outliers removed
# BCV Identified high dispersion genes. Running PC analysis
P7.Fb.dat.filter.BCV.pca<-prcomp(t(log2(exprs(P7.Fb.dat.filter[P7.Fb.dat.high_bcv_genes,])+1)),center=T,scale. = TRUE)

# Plotting the PCA graphs
# Plotting the first 2 PCs and coloring by age
hvPCA1<-ggbiplot(P7.Fb.dat.filter.BCV.pca,choices=c(1,2),scale=0,groups=pData(P7.Fb.dat.filter)$age,ellipse=T,var.axes=F) + scale_color_manual(values=c("darkgreen","red")) + monocle:::monocle_theme_opts()

# Plotting the first 2 PCs and coloring by region
hvPCA2<-ggbiplot(P7.Fb.dat.filter.BCV.pca,choices=c(1,2),scale=0,groups=pData(P7.Fb.dat.filter)$region,ellipse=T,var.axes=F) + scale_color_brewer(palette="Set1") + monocle:::monocle_theme_opts()

# Plotting the first 2 PCs and coloring by plate the cell was sequenced from
hvPCA3<-ggbiplot(P7.Fb.dat.filter.BCV.pca,choices=c(1,2),scale=0,groups=pData(P7.Fb.dat.filter)$split_plate,ellipse=T,var.axes=F) + scale_color_brewer(palette="Set1") + monocle:::monocle_theme_opts()

# Show the plots in the terminal
hvPCA1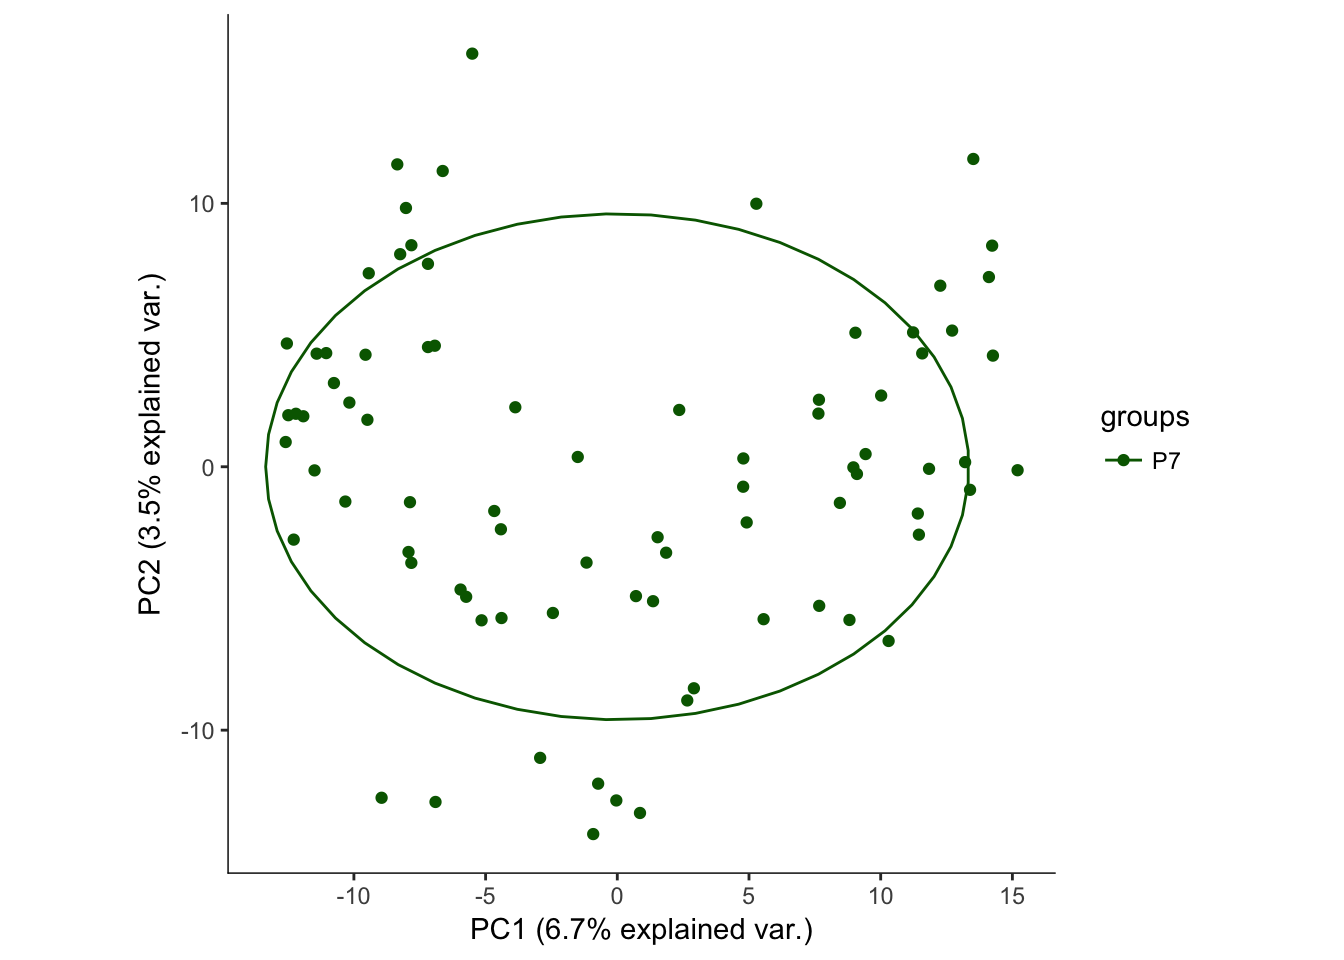
hvPCA2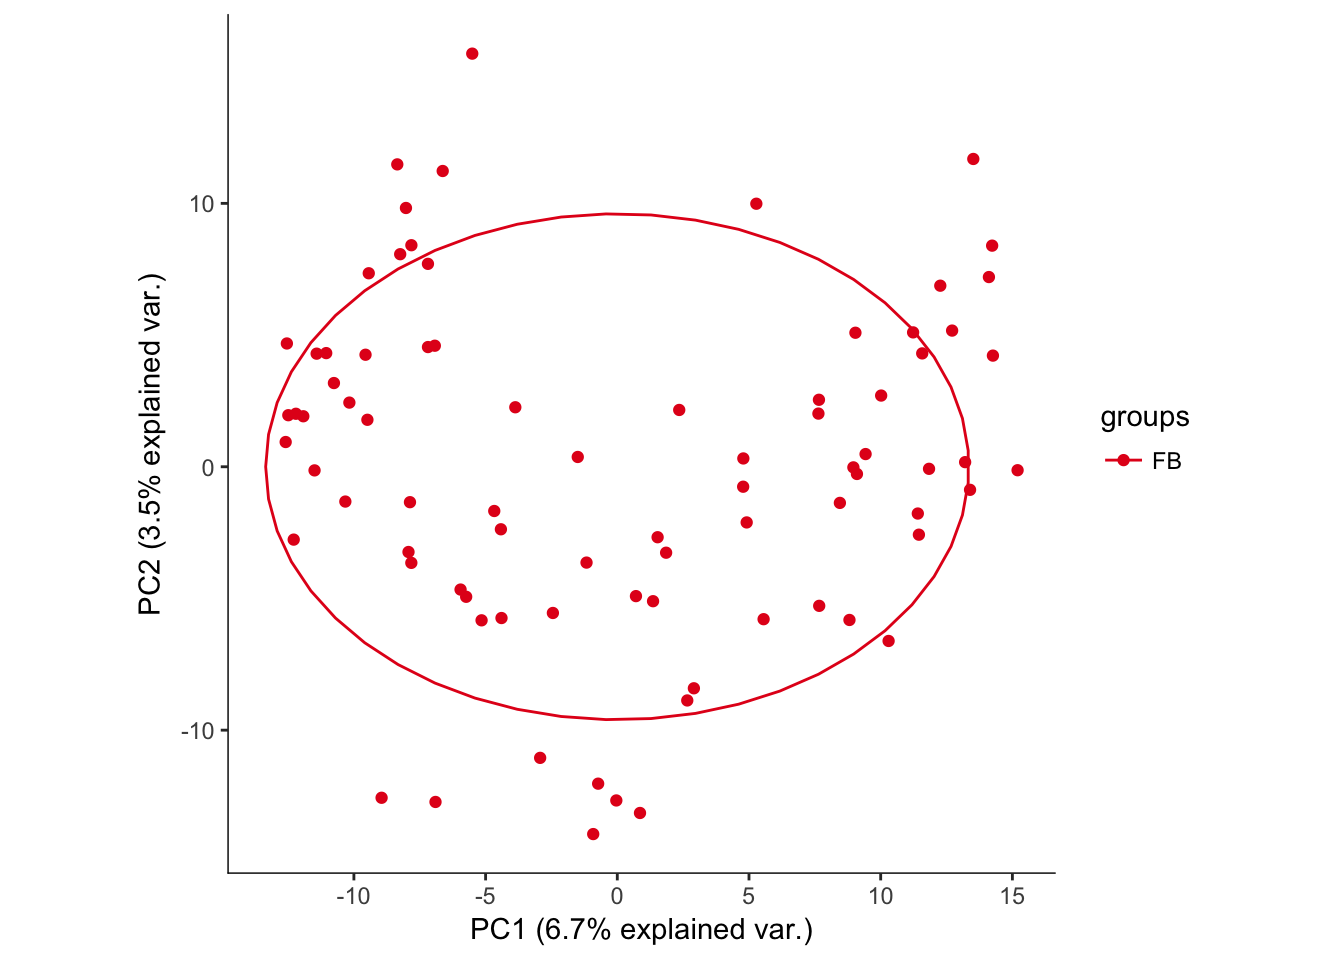
hvPCA3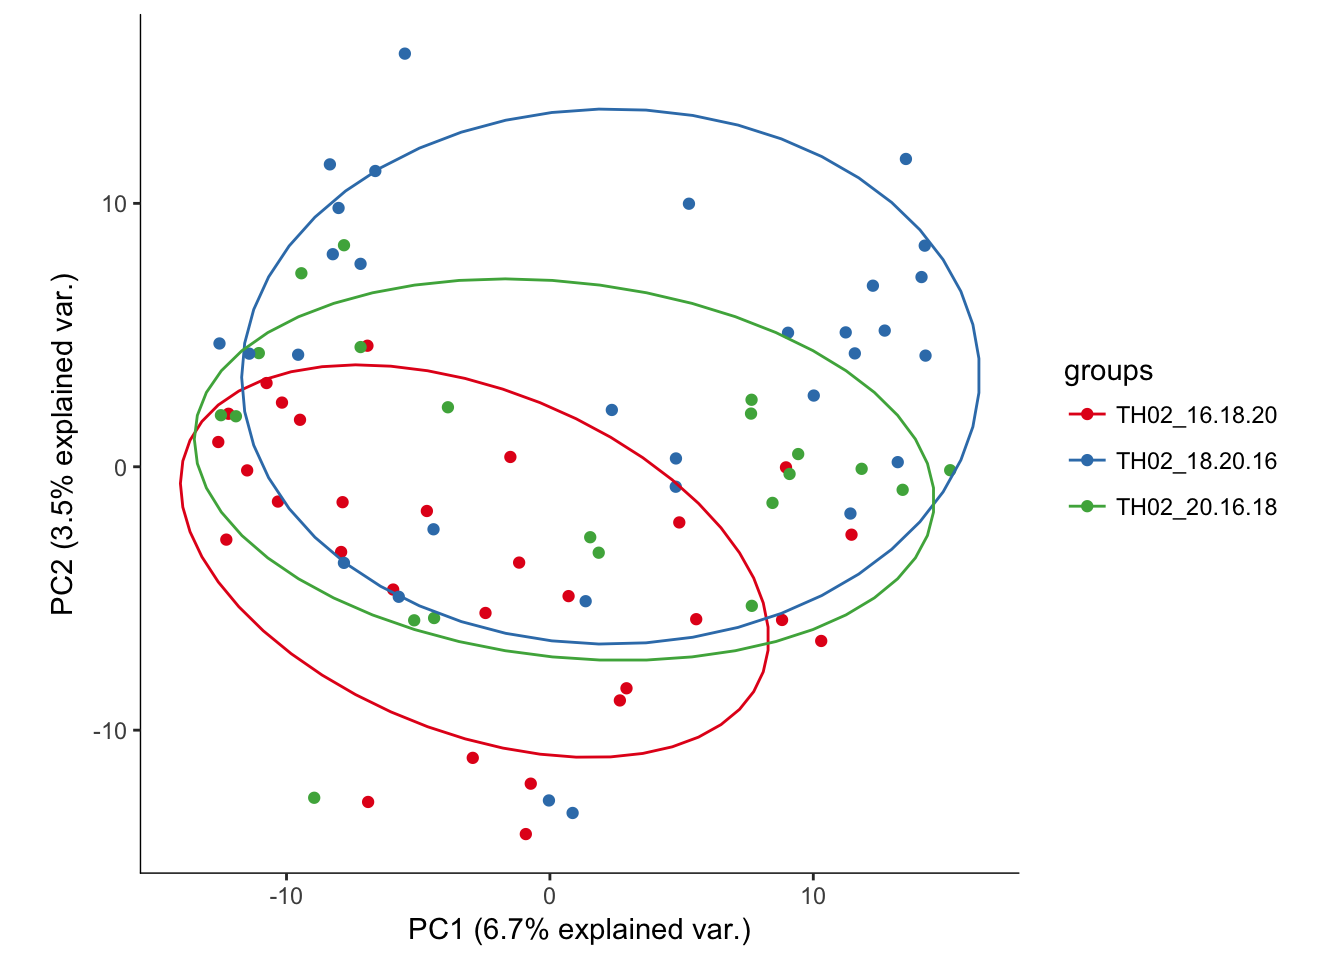
Screeplots
Viewing screeplots and determining the number of “significant” PCs. Since no additional outliers were identified in the PCA plot above, we will continue with the analysis with only the original outliers removed
# Making a screeplot of the BCV PCA. This will help determine how many
# principal components we should use in our tSNE visualization

# Show this plot
screeplot(P7.Fb.dat.filter.BCV.pca, npcs = 30, main = "P7 FB - High BCV Genes Screeplot")
abline(v = 4.5, lwd = 2, col = "red")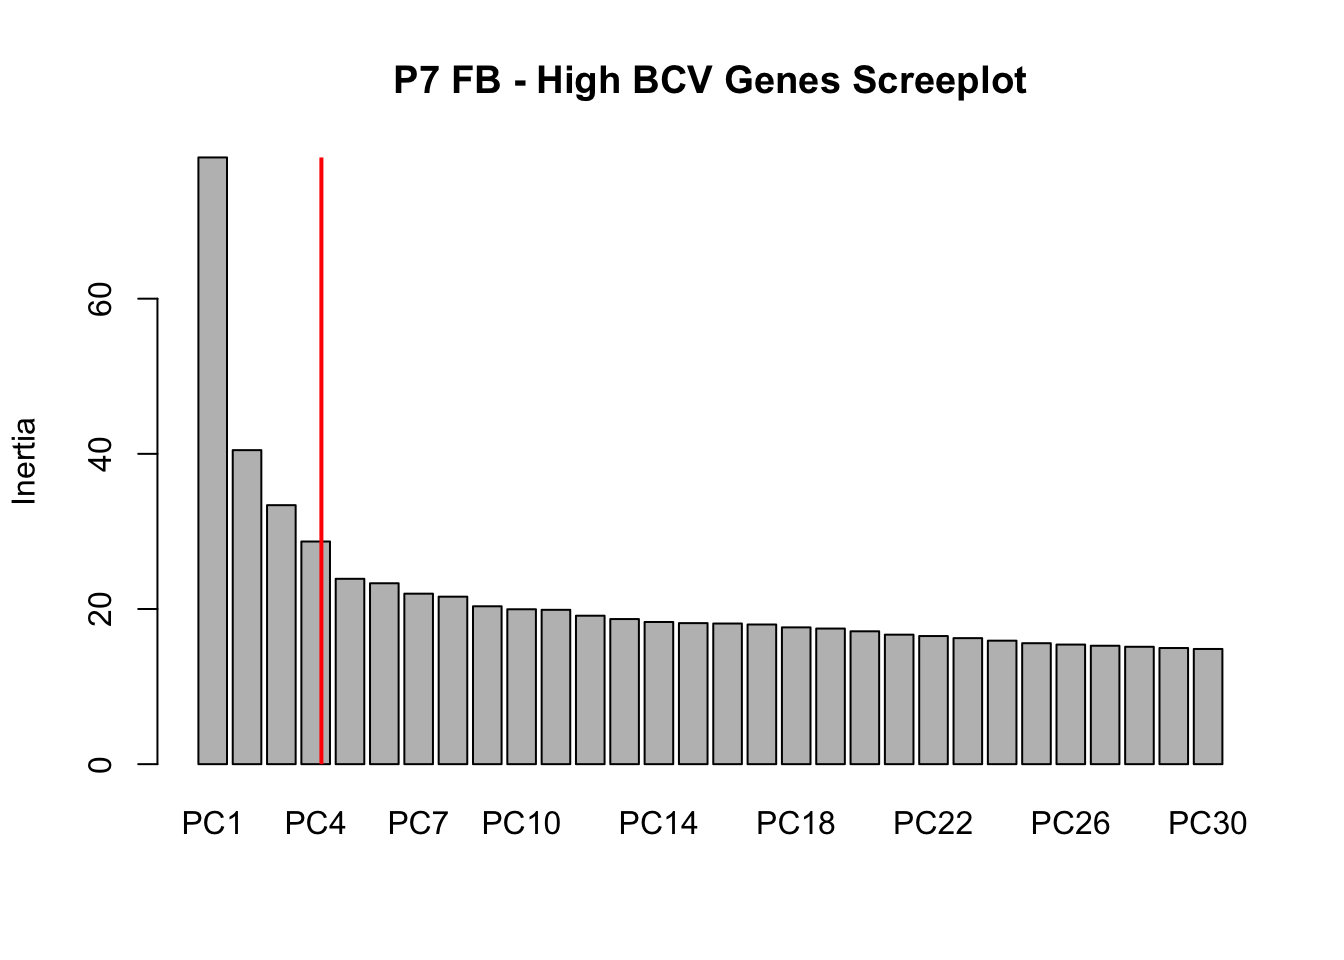
ggscreeplot(P7.Fb.dat.filter.BCV.pca, type = "pev")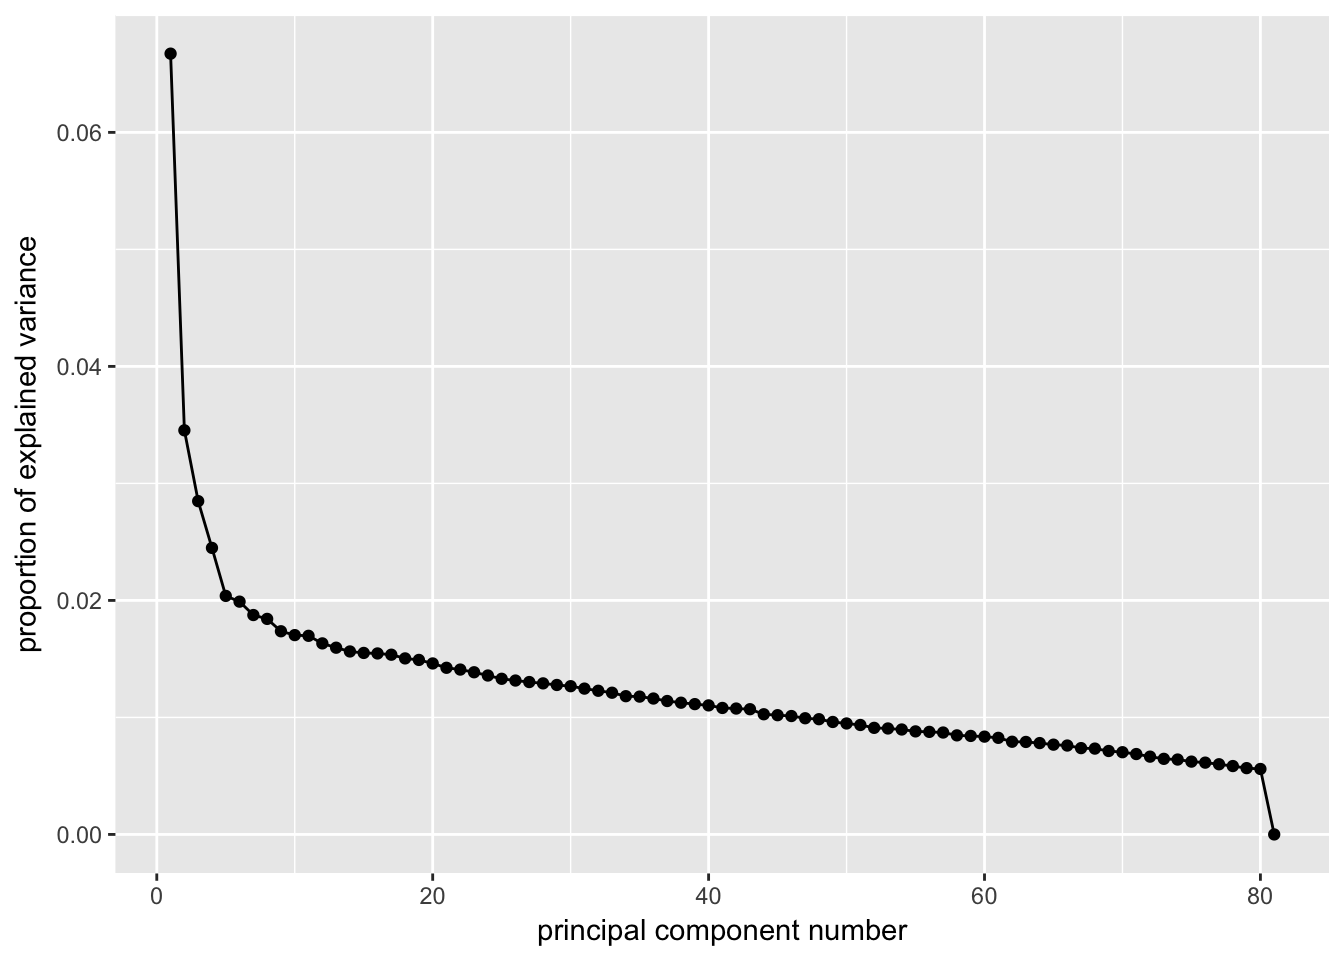
# Conclustion: Seems to be clear that just the first 4 PCs explain the most
# variation in our data
Creating a t-SNE plot from the “significant” PCs with outliers removed
nComponents<-4 # estimated from the screeplots
#seed <- runif(1,1,9999) # determined by testing random seeds
seed <- 5348.333
set.seed(seed) #setting seed

P7.Fb.dat.filter.BCV.tsne<-tsne(P7.Fb.dat.filter.BCV.pca$x[,1:nComponents],perplexity=5,max_iter=5000,whiten = FALSE)

pData(P7.Fb.dat.filter)$tSNE1_pos<-P7.Fb.dat.filter.BCV.tsne[,1]
pData(P7.Fb.dat.filter)$tSNE2_pos<-P7.Fb.dat.filter.BCV.tsne[,2]

P7.Fb.dat.filter.BCV.tsne.plot<-myTSNEPlotAlpha(P7.Fb.dat.filter,color="region", shape="age") + scale_color_brewer(palette="Set1") + ggtitle("P7 Fb - BCV tSNE Plot")

P7.Fb.dat.filter.BCV.tsne.plot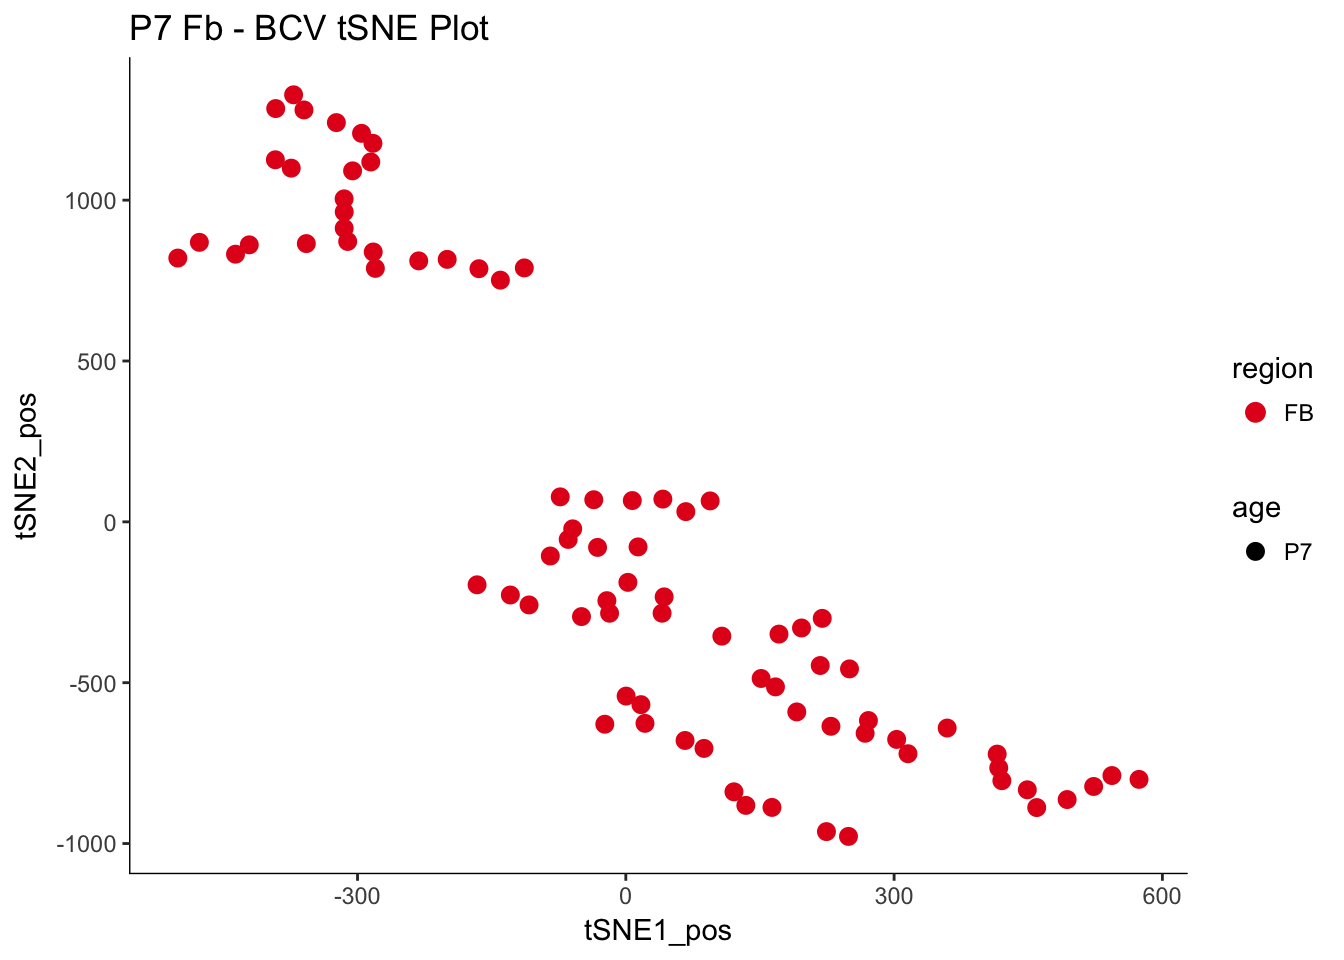
Identifying clusters
Identifying clusters in the data in an unsupervised manner with outliers removed
# Going to attempt to use the R program 'ADPclust' to determine how many
# clusters our data has

library(ADPclust)

# Running ADPclust
clust.res <- adpclust(x = P7.Fb.dat.filter.BCV.tsne, draw = T)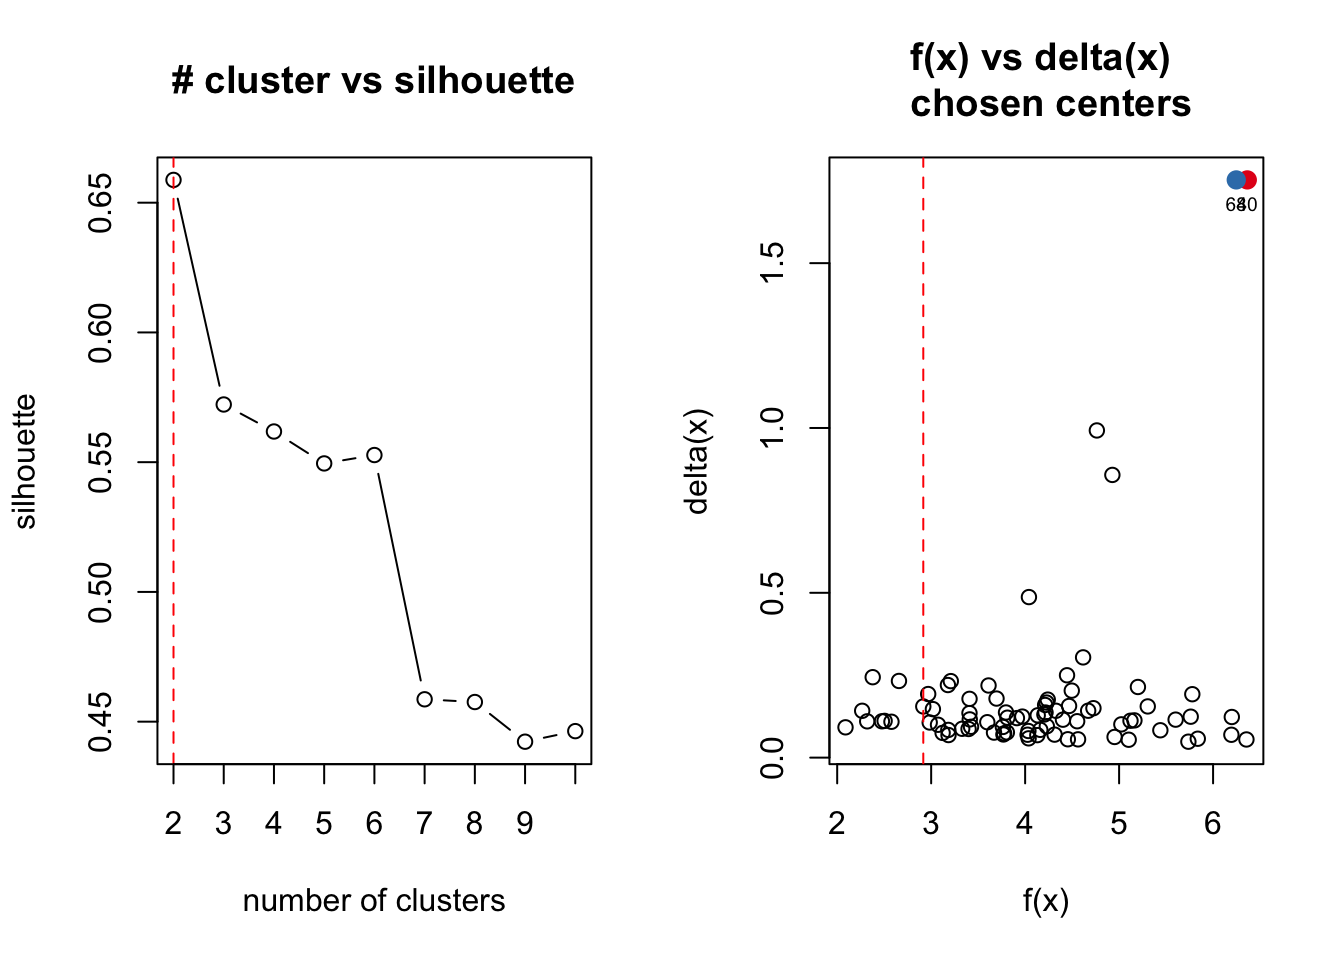
# Extracting the 'best partition' (aka the best cluster) for each cell
clust.res.df <- as.data.frame(clust.res$cluster)

# Adding the cluster assignment for each cell to the pData
pData(P7.Fb.dat.filter)$kmeans_tSNE_cluster <- as.factor(clust.res.df$`clust.res$cluster`)

# Plotting the same tSNE plot as above but coloring with the 'clusters'
myTSNEPlotAlpha(P7.Fb.dat.filter, color = "kmeans_tSNE_cluster", shape = "age") +
    scale_color_brewer(palette = "Set1") + ggtitle("All Cells - BCV tSNE with Clusters Plot")
## Scale for 'colour' is already present. Adding another scale for
## 'colour', which will replace the existing scale.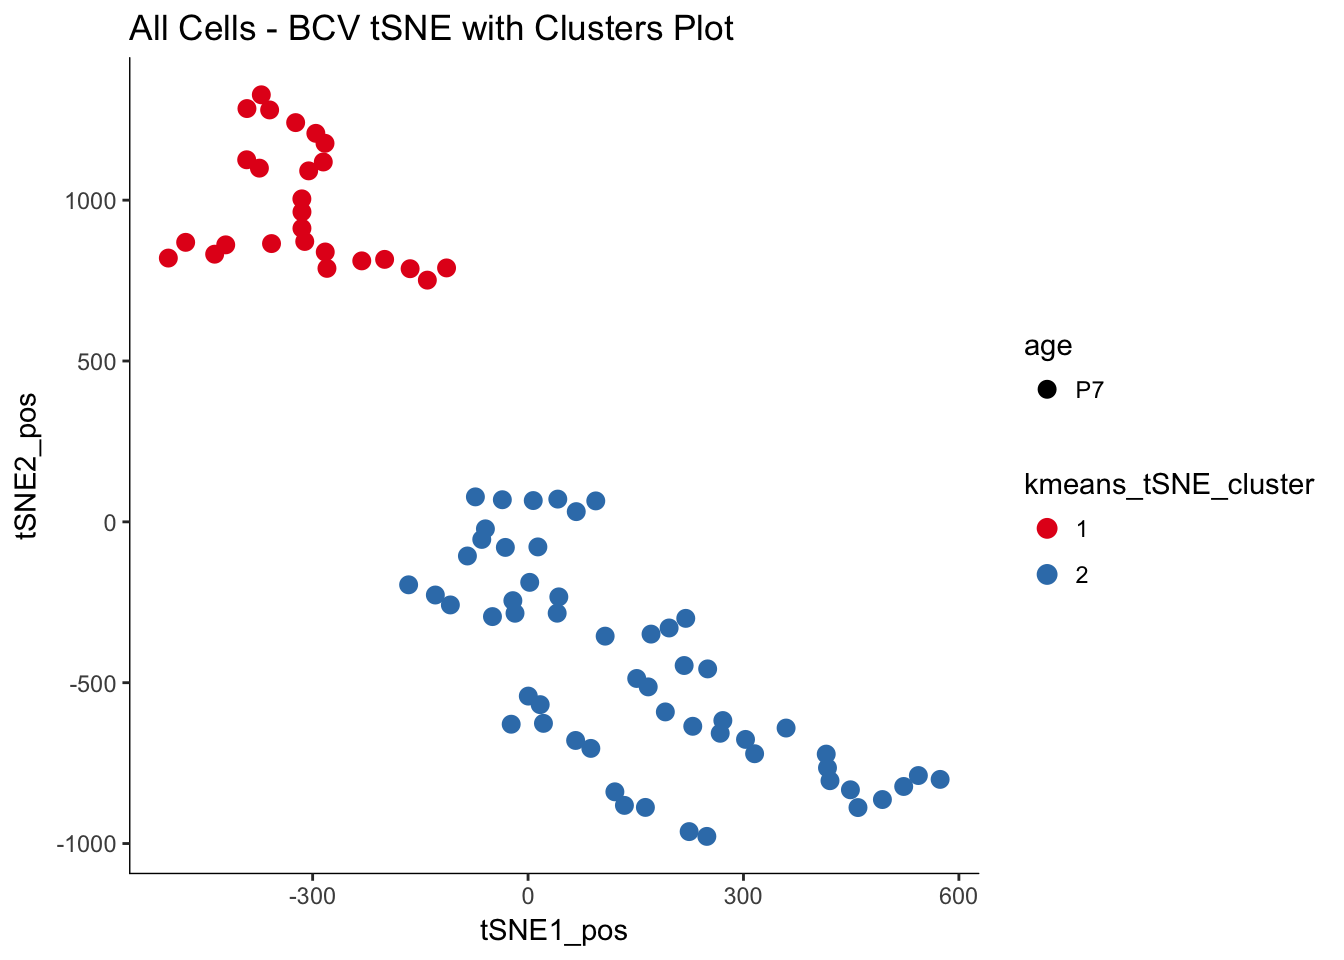
QC on the clusters with outliers removed
# Distribution of number of genes expressed in clusters
q <- ggplot(pData(P7.Fb.dat.filter)) +
  geom_density(aes(x=num_genes_expressed,fill=kmeans_tSNE_cluster),alpha=0.3) + scale_fill_brewer(palette="Set1") + facet_grid(.~age) + monocle:::monocle_theme_opts()

q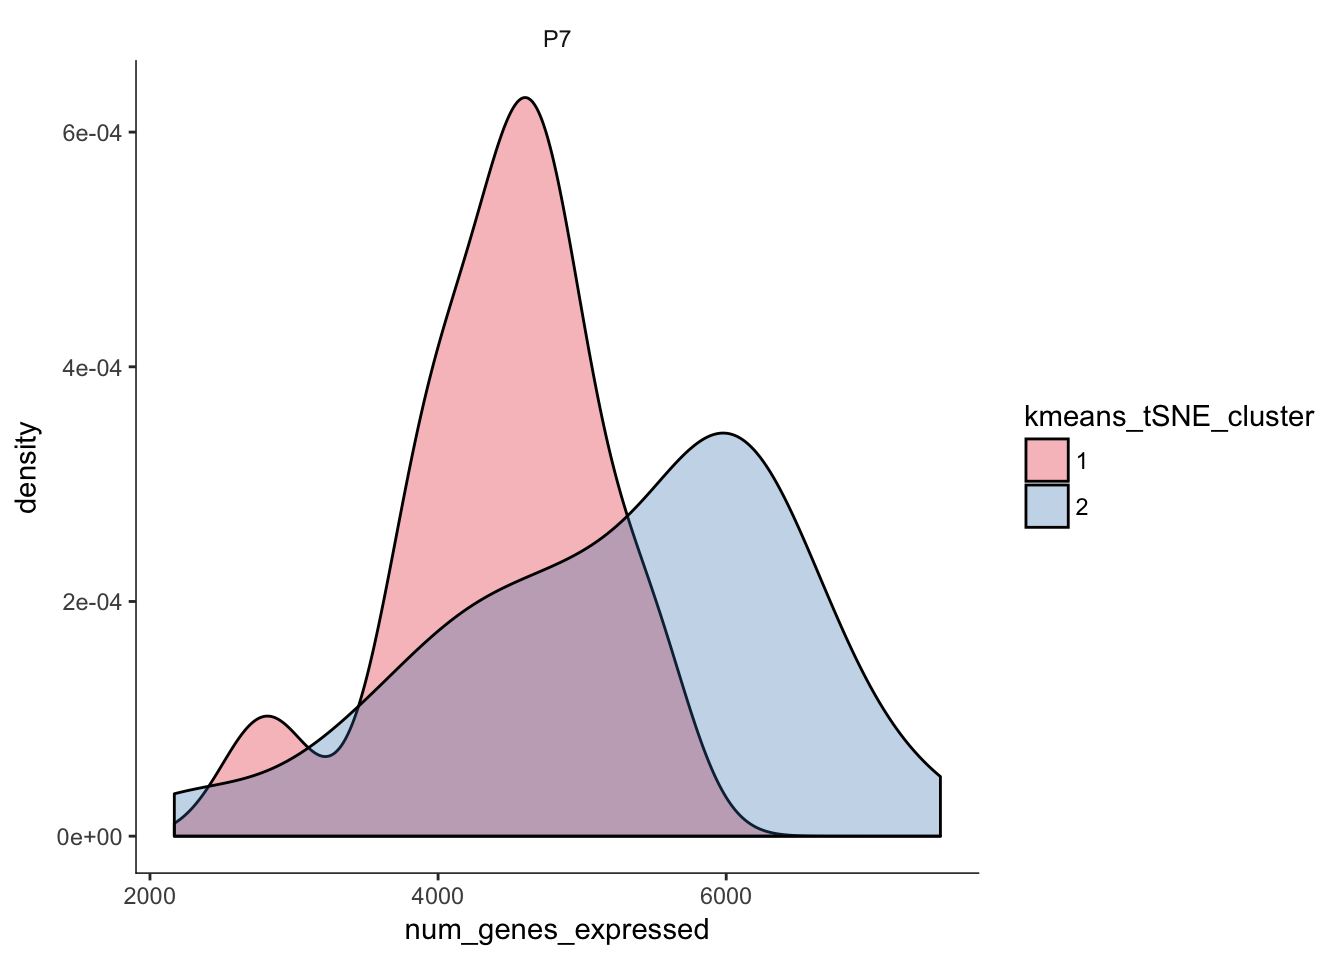
# Plotting the distribution of total mRNAs in clusters
q<-ggplot(pData(P7.Fb.dat.filter)) +
  geom_density(aes(x=Total_mRNAs,fill=kmeans_tSNE_cluster),alpha=0.3) + scale_fill_brewer(palette="Set1") + facet_grid(.~age) + monocle:::monocle_theme_opts()

q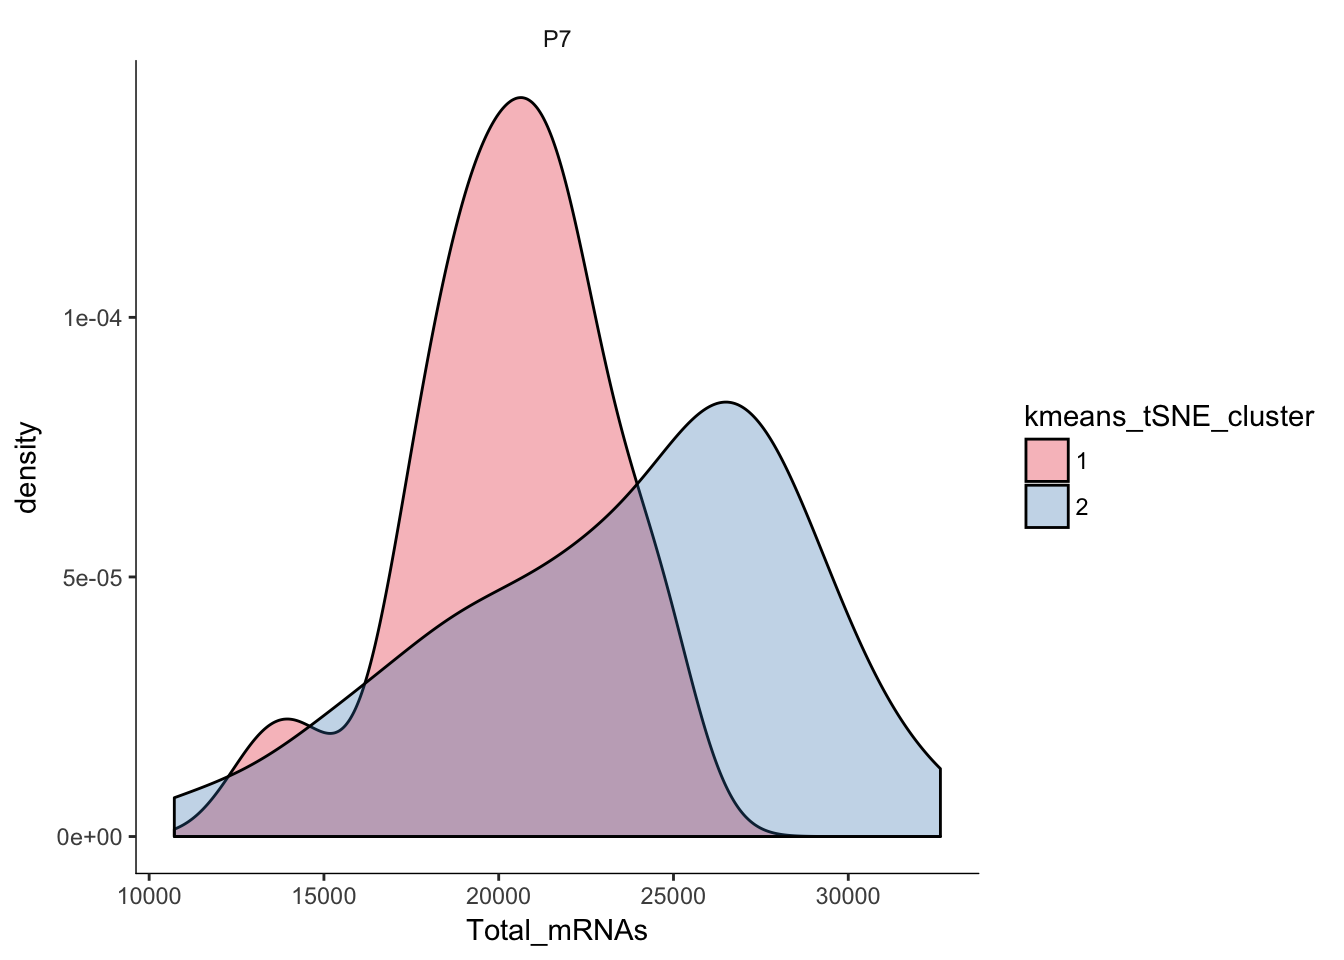
Saving the P7 FB final cds
P7.Fb.dat.filter.final <- P7.Fb.dat.filter
saveRDS(object = P7.Fb.dat.filter.final, file = file.path(Rdata_dir, "P7.Fb.dat.filter.final.Rds"))
Extracting pData information and saving it
P7.Fb.clusters.df <- pData(P7.Fb.dat.filter)[,c(1,39)]
saveRDS(P7.Fb.clusters.df, file = file.path(Rdata_dir, "P7.Fb.clusters.df.rds"))
Session Info
sessionInfo()## R version 3.3.0 (2016-05-03)
## Platform: x86_64-apple-darwin13.4.0 (64-bit)
## Running under: OS X 10.11.6 (El Capitan)
##
## locale:
## [1] en_US.UTF-8/en_US.UTF-8/en_US.UTF-8/C/en_US.UTF-8/en_US.UTF-8
##
## attached base packages:
## [1] grid splines stats4 parallel stats graphics grDevices
## [8] utils datasets methods base
##
## other attached packages:
## [1] ADPclust_0.7 ggbiplot_0.55 scales_0.5.0
## [4] SC3_1.1.4 ROCR_1.0-7 jackstraw_1.1.1
## [7] lfa_1.2.2 tsne_0.1-3 gridExtra_2.3
## [10] slackr_1.4.2 vegan_2.4-4 permute_0.9-4
## [13] MASS_7.3-47 gplots_3.0.1 RColorBrewer_1.1-2
## [16] Hmisc_4.0-3 Formula_1.2-2 survival_2.41-3
## [19] lattice_0.20-35 Heatplus_2.18.0 Rtsne_0.13
## [22] pheatmap_1.0.8 tidyr_0.7.1 dplyr_0.7.4
## [25] plyr_1.8.4 heatmap.plus_1.3 stringr_1.2.0
## [28] marray_1.50.0 limma_3.28.21 reshape2_1.4.3
## [31] monocle_2.2.0 DDRTree_0.1.5 irlba_2.2.1
## [34] VGAM_1.0-2 ggplot2_2.2.1 Biobase_2.32.0
## [37] BiocGenerics_0.18.0 Matrix_1.2-11
##
## loaded via a namespace (and not attached):
## [1] RSelenium_1.7.1 colorspace_1.3-2 class_7.3-14
## [4] rprojroot_1.2 htmlTable_1.9 corpcor_1.6.9
## [7] base64enc_0.1-3 mvtnorm_1.0-6 codetools_0.2-15
## [10] doParallel_1.0.11 robustbase_0.92-7 knitr_1.17
## [13] jsonlite_1.5 cluster_2.0.6 semver_0.2.0
## [16] shiny_1.0.5 rrcov_1.4-3 httr_1.3.1
## [19] backports_1.1.1 assertthat_0.2.0 lazyeval_0.2.1
## [22] formatR_1.5 acepack_1.4.1 htmltools_0.3.6
## [25] tools_3.3.0 bindrcpp_0.2 igraph_1.1.2
## [28] gtable_0.2.0 glue_1.1.1 binman_0.1.0
## [31] doRNG_1.6.6 Rcpp_0.12.14 slam_0.1-37
## [34] gdata_2.18.0 nlme_3.1-131 iterators_1.0.8
## [37] mime_0.5 rngtools_1.2.4 gtools_3.5.0
## [40] WriteXLS_4.0.0 XML_3.98-1.9 DEoptimR_1.0-8
## [43] yaml_2.1.15 pkgmaker_0.22 rpart_4.1-11
## [46] fastICA_1.2-1 latticeExtra_0.6-28 stringi_1.1.5
## [49] pcaPP_1.9-72 foreach_1.4.3 e1071_1.6-8
## [52] checkmate_1.8.4 caTools_1.17.1 rlang_0.1.6
## [55] pkgconfig_2.0.1 matrixStats_0.52.2 bitops_1.0-6
## [58] qlcMatrix_0.9.5 evaluate_0.10.1 purrr_0.2.4
## [61] bindr_0.1 labeling_0.3 htmlwidgets_0.9
## [64] magrittr_1.5 R6_2.2.2 combinat_0.0-8
## [67] wdman_0.2.2 foreign_0.8-69 mgcv_1.8-22
## [70] nnet_7.3-12 tibble_1.3.4 KernSmooth_2.23-15
## [73] rmarkdown_1.8 data.table_1.10.4 HSMMSingleCell_0.106.2
## [76] digest_0.6.12 xtable_1.8-2 httpuv_1.3.5
## [79] openssl_0.9.7 munsell_0.4.3 registry_0.3This R Markdown site was created with workflowr