P7 All Recursive Analysis
Paul Hook
Last update: 2018-01-18
Code version: 5996c19850dc5fc65723f30bc33ab1c8d083a7e6
Setting important directories
Also loading important libraries and custom functions for analysis.
seq_dir <- "/Volumes/PAULHOOK/sc-da-parkinsons/data"
file_dir <- "/Volumes/PAULHOOK/sc-da-parkinsons/output"
Rdata_dir <- "/Volumes/PAULHOOK/sc-da-parkinsons/data"
Script_dir <- "/Volumes/PAULHOOK/sc-da-parkinsons/code"
source(file.path(Script_dir,'init.R'))
source(file.path(Script_dir,"tools_R.r"))
Loading P7 all cells .rds
P7.dat.filter <- readRDS(file = file.path(Rdata_dir, "P7.dat.filter.rds"))Removing outliers identified in the recursive analyses
# Removing outliers from other analyses
Ob.outliers <- readRDS(file = file.path(Rdata_dir, "P7.Ob.outliers.rds"))

Mb.outliers <- readRDS(file = file.path(Rdata_dir, "P7.Mb.outliers.rds"))

Fb.outliers <- readRDS(file = file.path(Rdata_dir, "P7.Fb.outliers.rds"))

P7.outliers <- c(Mb.outliers, Ob.outliers, Fb.outliers)

saveRDS(object = P7.outliers, file = file.path(Rdata_dir,"P7.outliers.rds"))

P7.dat.filter <- readRDS(file = file.path(Rdata_dir, "P7.dat.filter.rds"))
nrow(pData(P7.dat.filter)) # 238
## [1] 238P7.dat.filter <- P7.dat.filter[,!(pData(P7.dat.filter)$sample_id.x %in% P7.outliers)]
nrow(pData(P7.dat.filter)) #224## [1] 224Filter genes by percentage of cells expresssing each gene
# Plot number of cells expressing each gene as histogram
hist(fData(P7.dat.filter)$num_cells_expressed,breaks=50,col="red",main="Cells expressed per gene")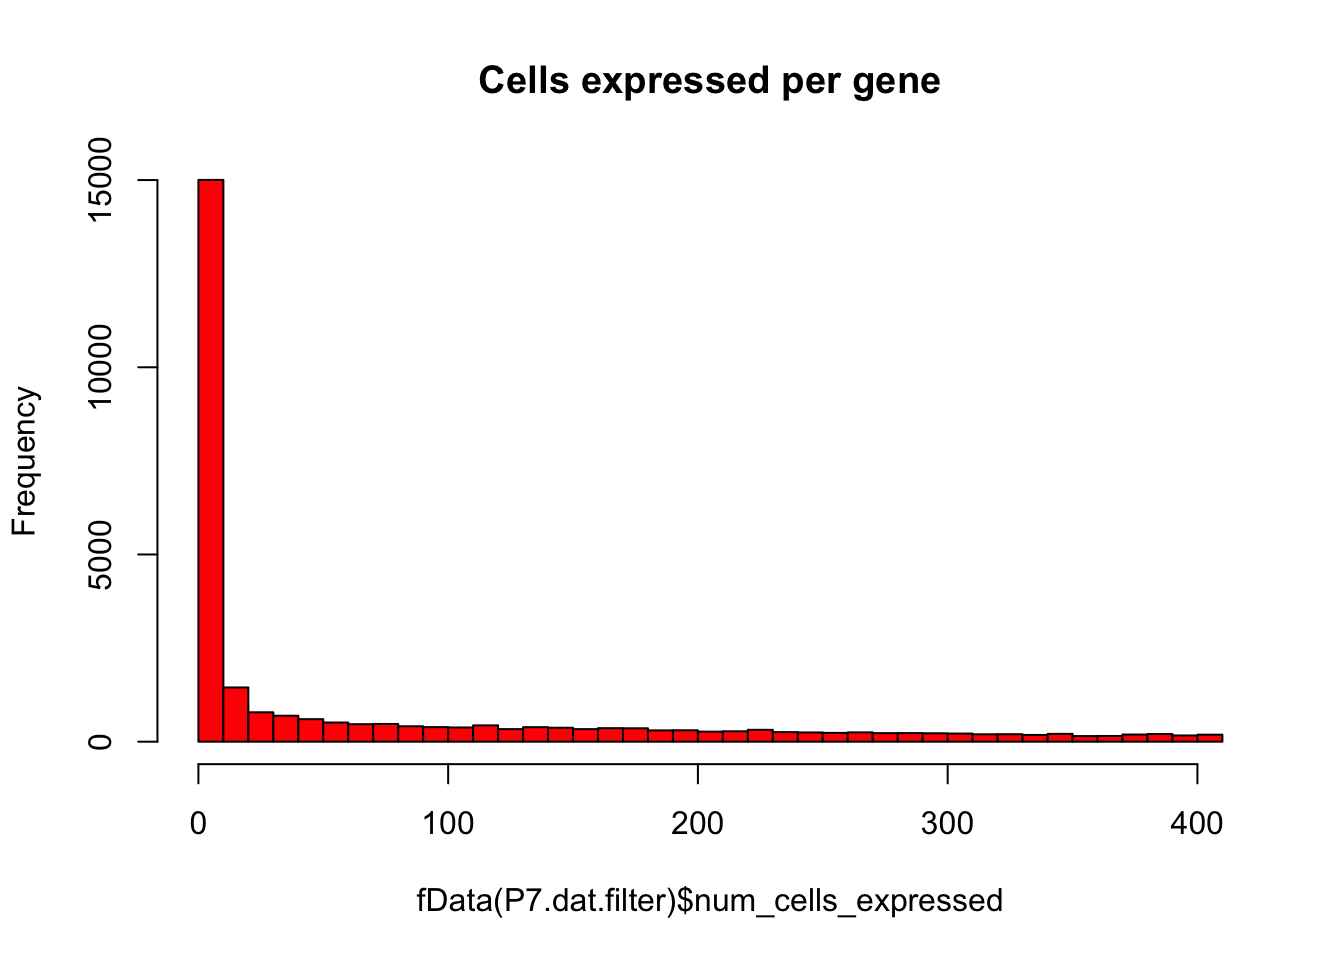
# Keep only expressed genes with expression in >= 5% of cells
numCellThreshold<-nrow(pData(P7.dat.filter))*0.05
P7.dat.expressed_genes<-row.names(subset(fData(P7.dat.filter),num_cells_expressed >= numCellThreshold))

# Same plot as above with threshold
hist(fData(P7.dat.filter)$num_cells_expressed,breaks=50,col="red",main="Cells expressed per gene - threshold")
abline(v=numCellThreshold,lty="dashed")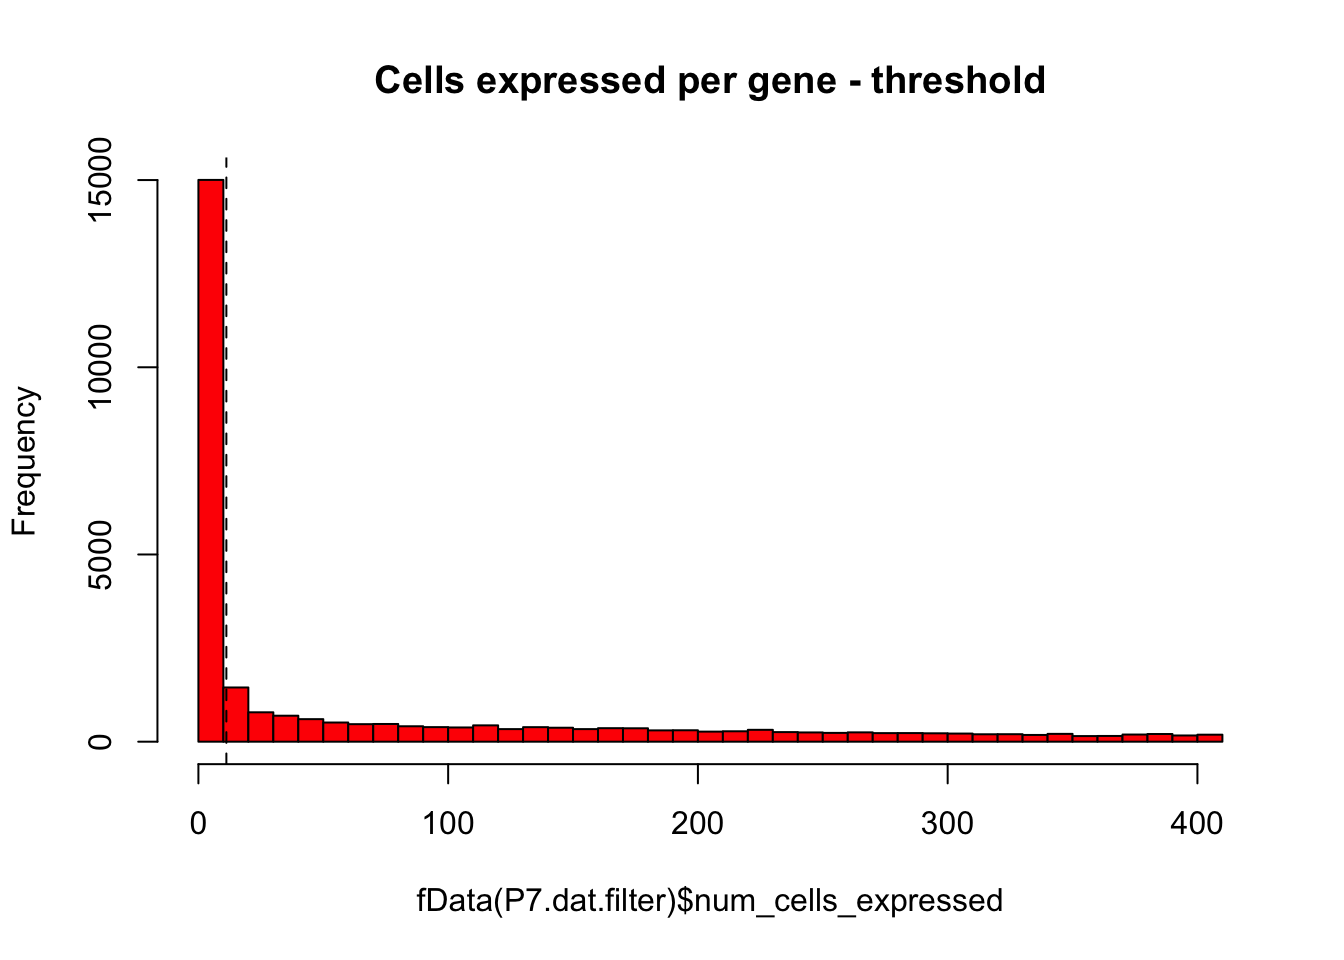
Prepping the Monocle model for analysis
# Only keeping "expressed" genes
P7.dat.filter <-P7.dat.filter[P7.dat.expressed_genes,]

# Estimating the size factors
P7.dat.filter <-estimateSizeFactors(P7.dat.filter)

# Estimating dispersions
P7.dat.filter <- estimateDispersions(P7.dat.filter,cores=8)
## Warning: Deprecated, use tibble::rownames_to_column() instead.## Removing 229 outliers# Removing 229 outliers
# Warning message:
# Deprecated, use tibble::rownames_to_column() instead. Calculating summary stats
# Calculating summary stats
fData(P7.dat.filter)$mean_expr<-apply(round(exprs(P7.dat.filter)),1,mean) # mean expression
fData(P7.dat.filter)$sd_expr<-apply(round(exprs(P7.dat.filter)),1,sd) # sd expression
fData(P7.dat.filter)$bcv<-(fData(P7.dat.filter)$sd_expr/fData(P7.dat.filter)$mean_expr)**2 # calculating biological coefficient of variation
fData(P7.dat.filter)$percent_detection<-(fData(P7.dat.filter)$num_cells_expressed/dim(P7.dat.filter)[2])*100 # calculating % detection
Identifying high dispersion genes
P7.dat.filter.genes <- P7.dat.filter # spoofing the CellDataSet
disp_table <- dispersionTable(P7.dat.filter.genes) # pulling out the dispersion table
unsup_clustering_genes <-subset(disp_table, mean_expression >= 0.5 & dispersion_empirical >= 1.5 * dispersion_fit) # subsetting the data to pull out genes with expression above 0.5 and dispersion empirical > 2
P7.dat.high_bcv_genes<-unsup_clustering_genes$gene_id # pulling out list of genes
P7.dat.filter.order <- setOrderingFilter(P7.dat.filter, unsup_clustering_genes$gene_id)
plot_ordering_genes(P7.dat.filter.order) # plotting the dispersion and genes
## Warning: Transformation introduced infinite values in continuous y-axis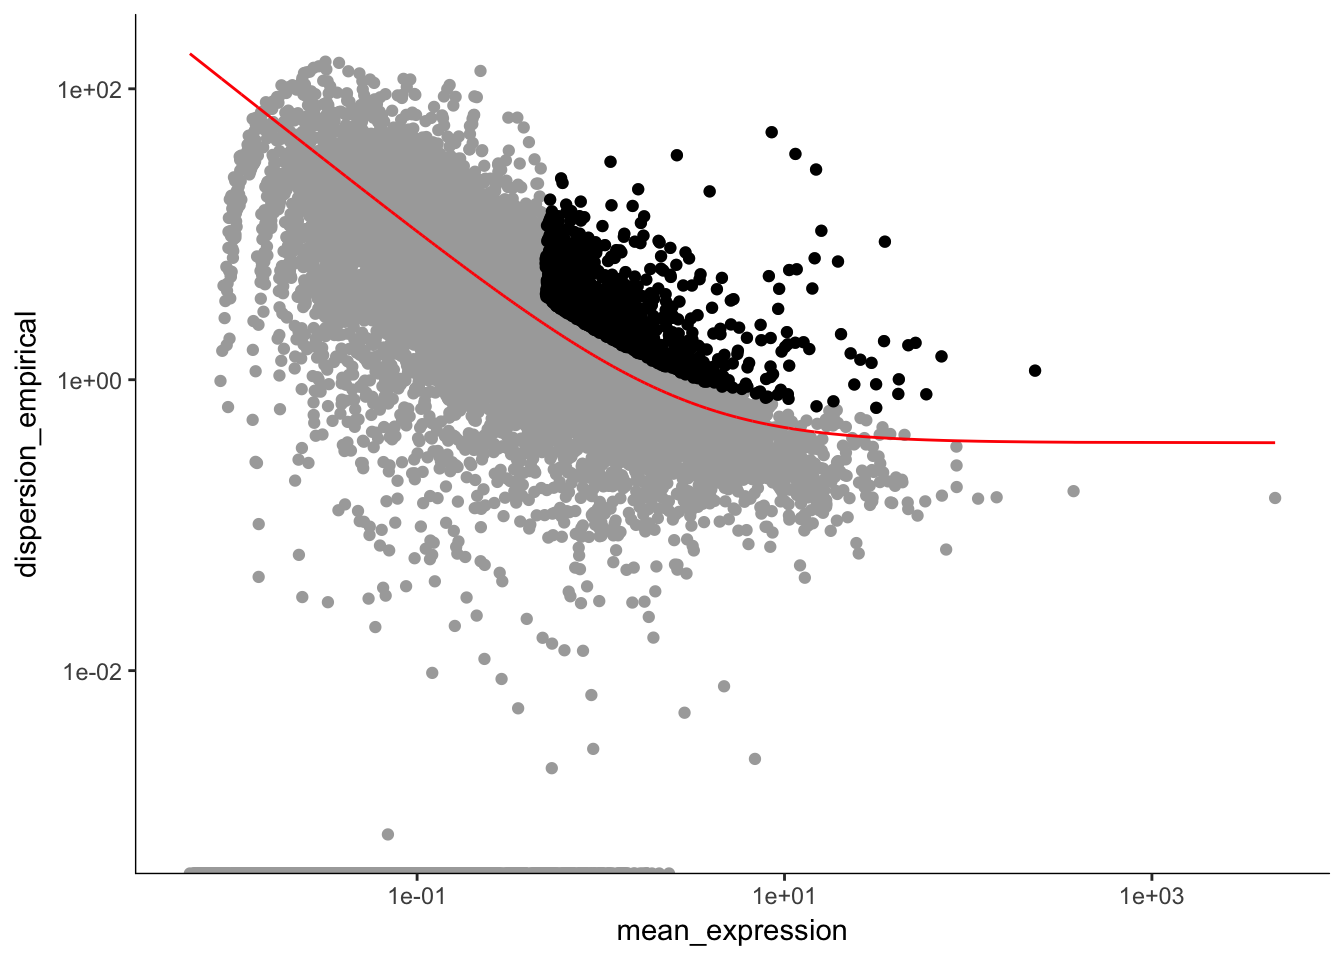
length(P7.dat.high_bcv_genes) # 1120## [1] 1120Running PCA with high dispersion genes
# BCV Identified high dispersion genes. Running PC analysis
P7.dat.filter.BCV.pca<-prcomp(t(log2(exprs(P7.dat.filter[P7.dat.high_bcv_genes,])+1)),center=T,scale. = TRUE)

# Plotting the PCA graphs
# Plotting the first 2 PCs and coloring by age
hvPCA1<-ggbiplot(P7.dat.filter.BCV.pca,choices=c(1,2),scale=0,groups=pData(P7.dat.filter)$age,ellipse=T,var.axes=F) + scale_color_manual(values=c("darkgreen","red")) + monocle:::monocle_theme_opts()

# Plotting the first 2 PCs and coloring by region
hvPCA2<-ggbiplot(P7.dat.filter.BCV.pca,choices=c(1,2),scale=0,groups=pData(P7.dat.filter)$region,ellipse=T,var.axes=F) + scale_color_brewer(palette="Set1") + monocle:::monocle_theme_opts() + ggtitle("All P7 PCA")

# Plotting the first 2 PCs and coloring by plate the cell was sequenced from
hvPCA3<-ggbiplot(P7.dat.filter.BCV.pca,choices=c(1,2),scale=0,groups=pData(P7.dat.filter)$split_plate,ellipse=T,var.axes=F) + scale_color_brewer(palette="Set1") + monocle:::monocle_theme_opts()

# Show the plots in the terminal
hvPCA1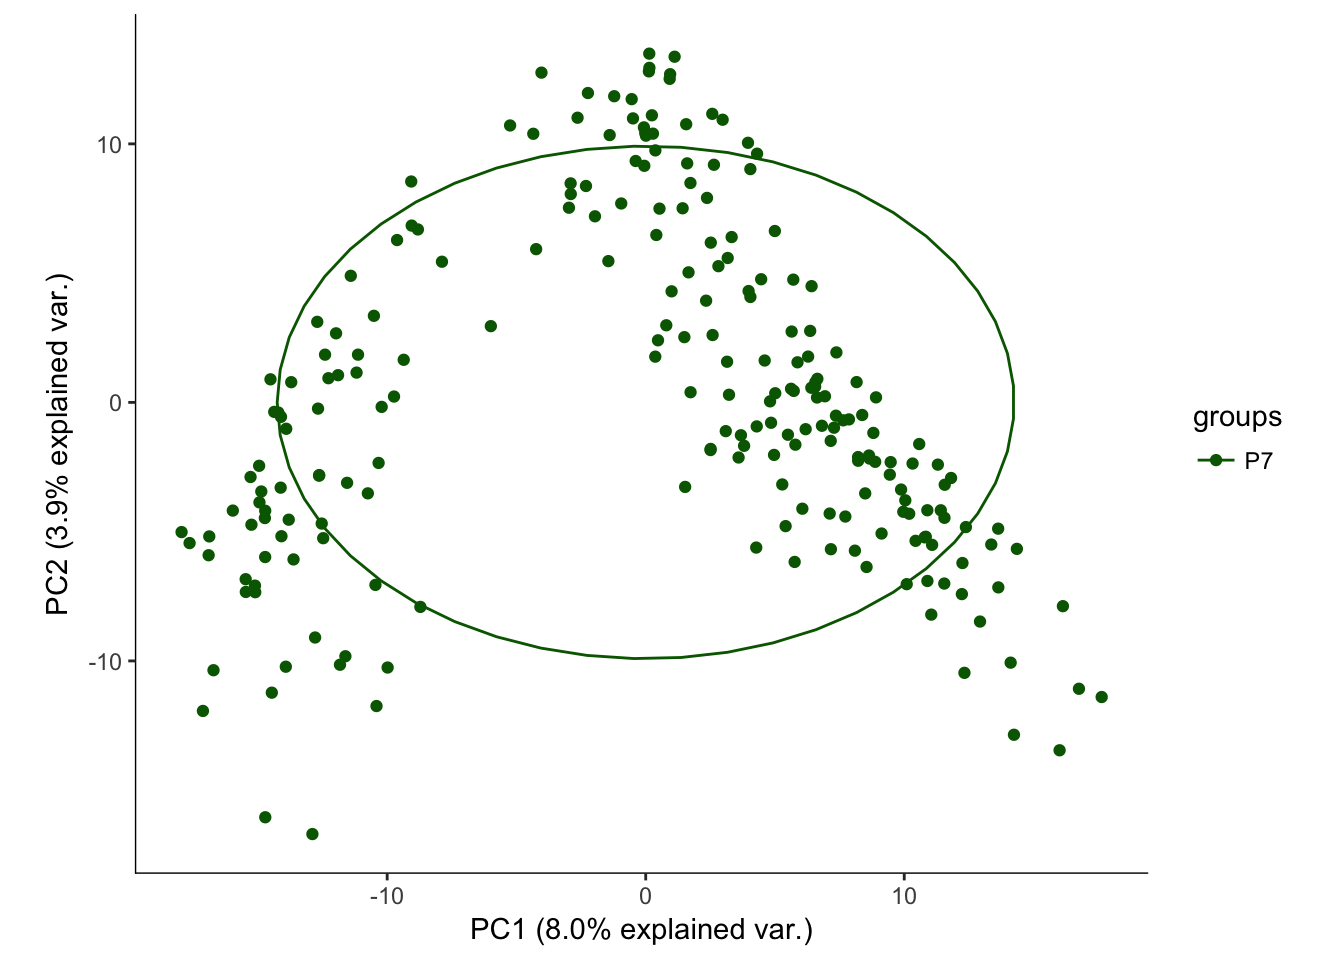
hvPCA2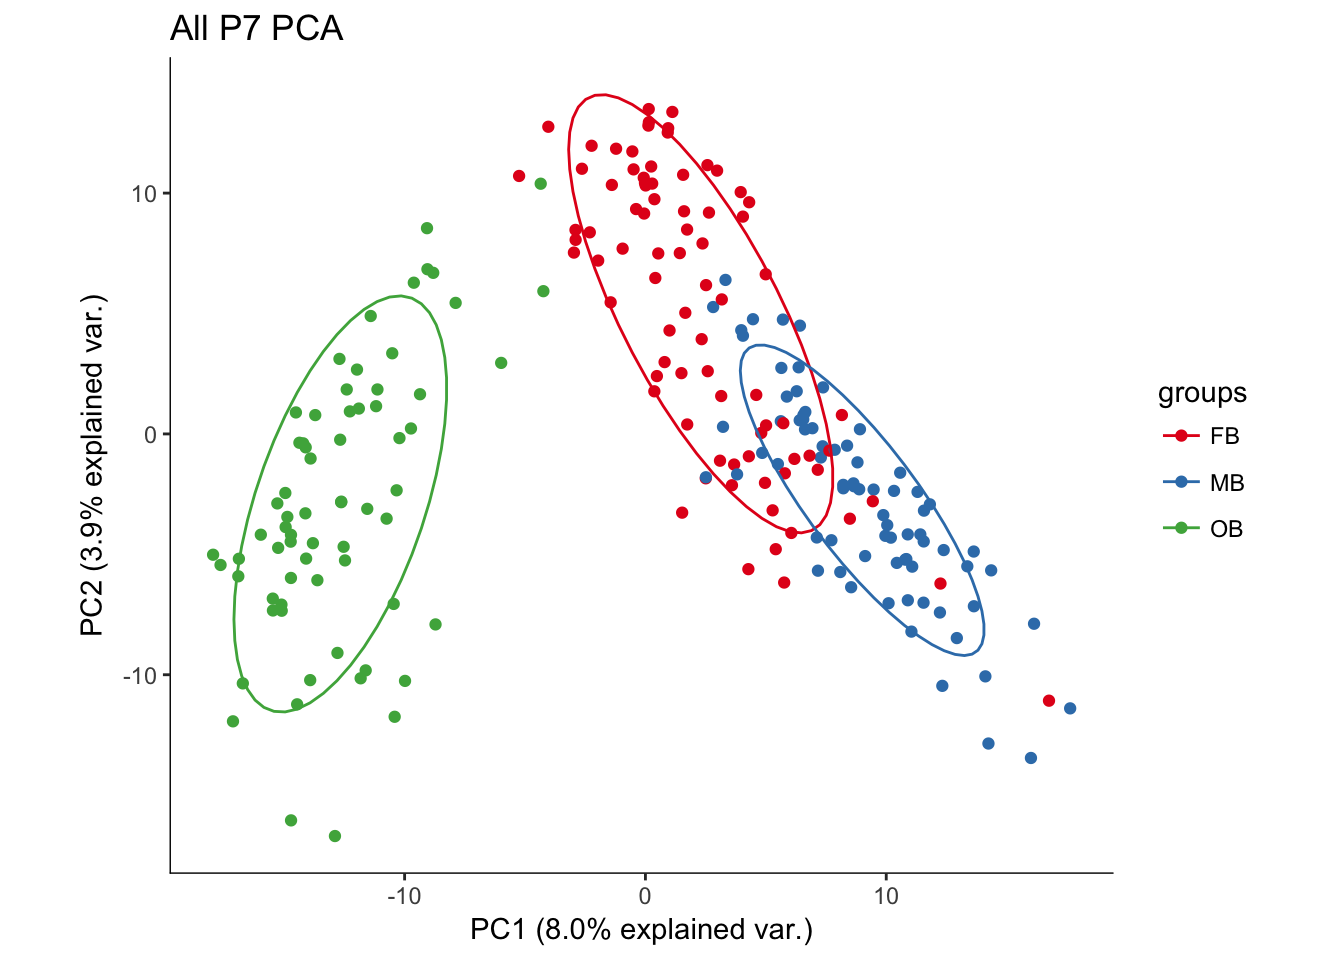
hvPCA3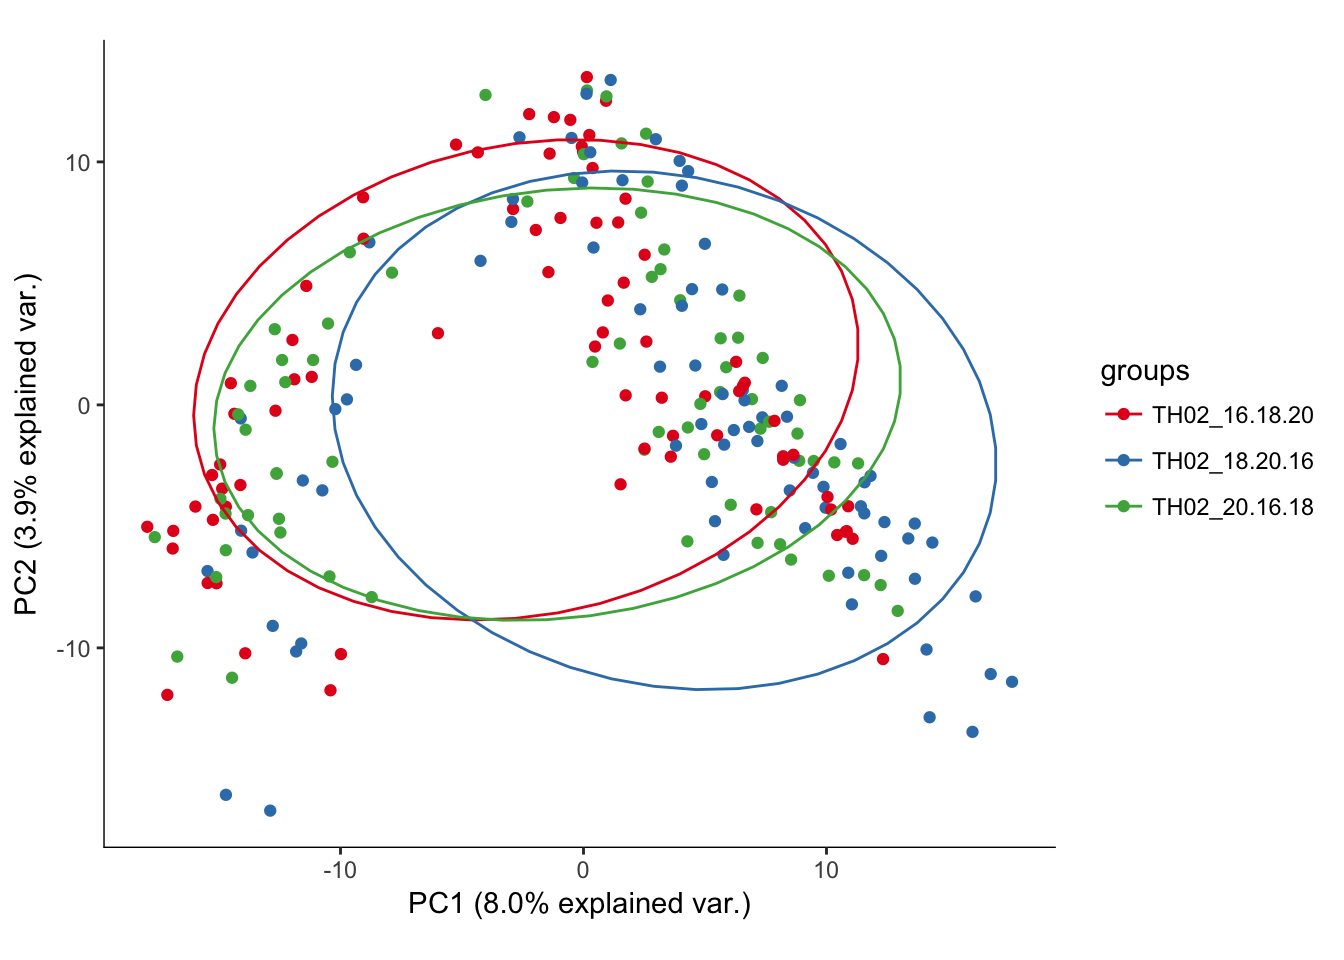
# No real outliers seenScreeplots
Viewing screeplots and determining the number of “significant” PCs.
# Making a screeplot of the BCV PCA. This will help determine how many
# principal components we should use in our tSNE visualization

# Show this plot
screeplot(P7.dat.filter.BCV.pca, npcs = 30, main = "e15.5 - High BCV Genes Screeplot")
abline(v = 5, lwd = 2, col = "red")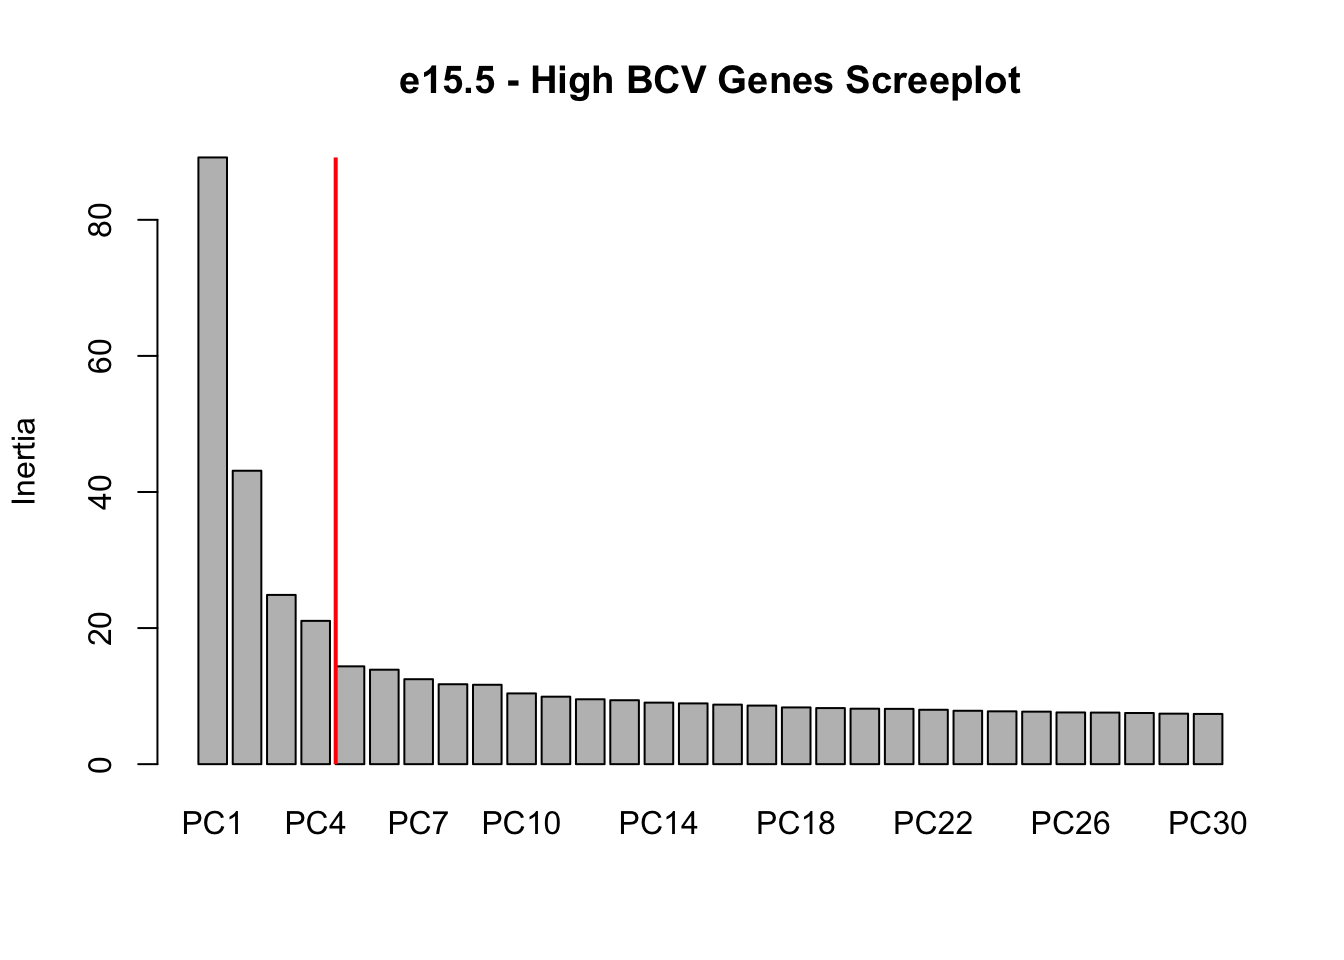
ggscreeplot(P7.dat.filter.BCV.pca)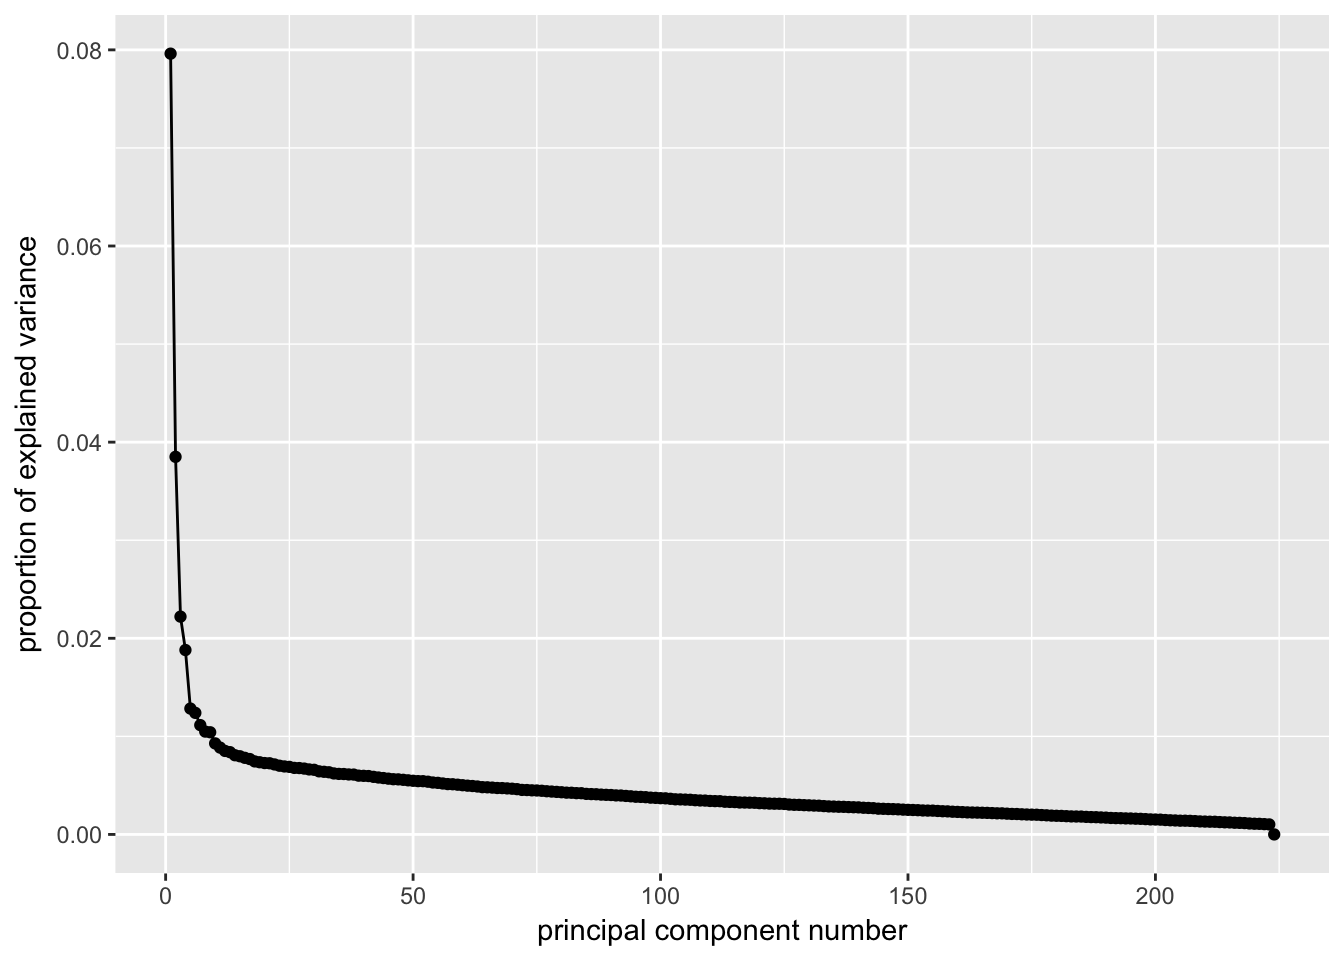
# Conclustion: Seems to be clear that just the first 4 PCs explain the most
# variation in our data
Creating a t-SNE plot from the “significant” PCs with outliers removed
nComponents<-4 # estimated from the screeplots
#seed <- runif(1,1,9999) # determined by testing random seeds
seed <- 1974.079
set.seed(seed) #setting seed

P7.dat.filter.BCV.tsne<-tsne(P7.dat.filter.BCV.pca$x[,1:nComponents],perplexity=30,max_iter=3000,whiten = FALSE)

pData(P7.dat.filter)$tSNE1_pos<-P7.dat.filter.BCV.tsne[,1]
pData(P7.dat.filter)$tSNE2_pos<-P7.dat.filter.BCV.tsne[,2]

P7.dat.filter.BCV.tsne.plot<-myTSNEPlotAlpha(P7.dat.filter,color="region", shape="age") + scale_color_brewer(palette="Set1") + ggtitle("P7 - BCV tSNE Plot")

P7.dat.filter.BCV.tsne.plot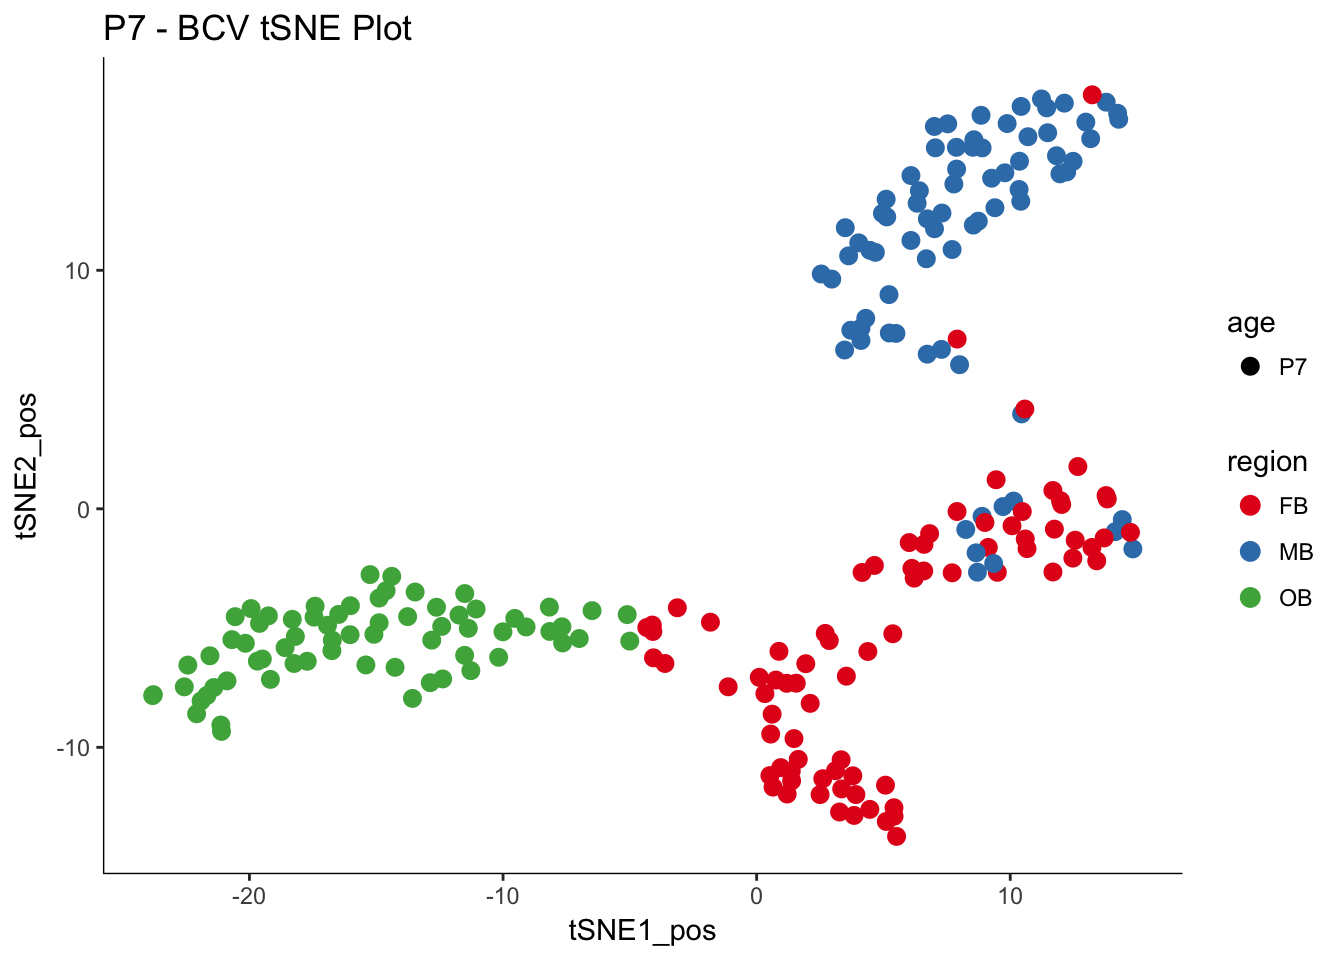
Adding MB/FB/OB subcluster annotation
P7.Ob.clusters.df <- readRDS(file = file.path(Rdata_dir, "P7.Ob.clusters.df.rds"))
P7.Mb.clusters.df <- readRDS(file = file.path(Rdata_dir, "P7.Mb.clusters.df.rds"))
P7.Fb.clusters.df <- readRDS(file = file.path(Rdata_dir, "P7.Fb.clusters.df.rds"))

P7.Ob.clusters.df$subset.cluster <- paste0("P7.OB.",P7.Ob.clusters.df$kmeans_tSNE_cluster)
P7.Mb.clusters.df$subset.cluster <- paste0("P7.MB.",P7.Mb.clusters.df$kmeans_tSNE_cluster)
P7.Fb.clusters.df$subset.cluster <- paste0("P7.FB.",P7.Fb.clusters.df$kmeans_tSNE_cluster)

Sub.clusters.df <- rbind(P7.Ob.clusters.df,P7.Mb.clusters.df,P7.Fb.clusters.df)

names(Sub.clusters.df) <- c("sample_id.x","remove","subset.cluster")
final.data.frame <- merge(x = pData(P7.dat.filter), y = Sub.clusters.df, by = "sample_id.x")
pData(P7.dat.filter)$subset.cluster <- as.factor(final.data.frame$subset.cluster)

myTSNEPlotAlpha(P7.dat.filter,color="subset.cluster", shape="age") + scale_color_brewer(palette="Set1") + ggtitle("P7 - BCV tSNE Plot")
## Scale for 'colour' is already present. Adding another scale for
## 'colour', which will replace the existing scale.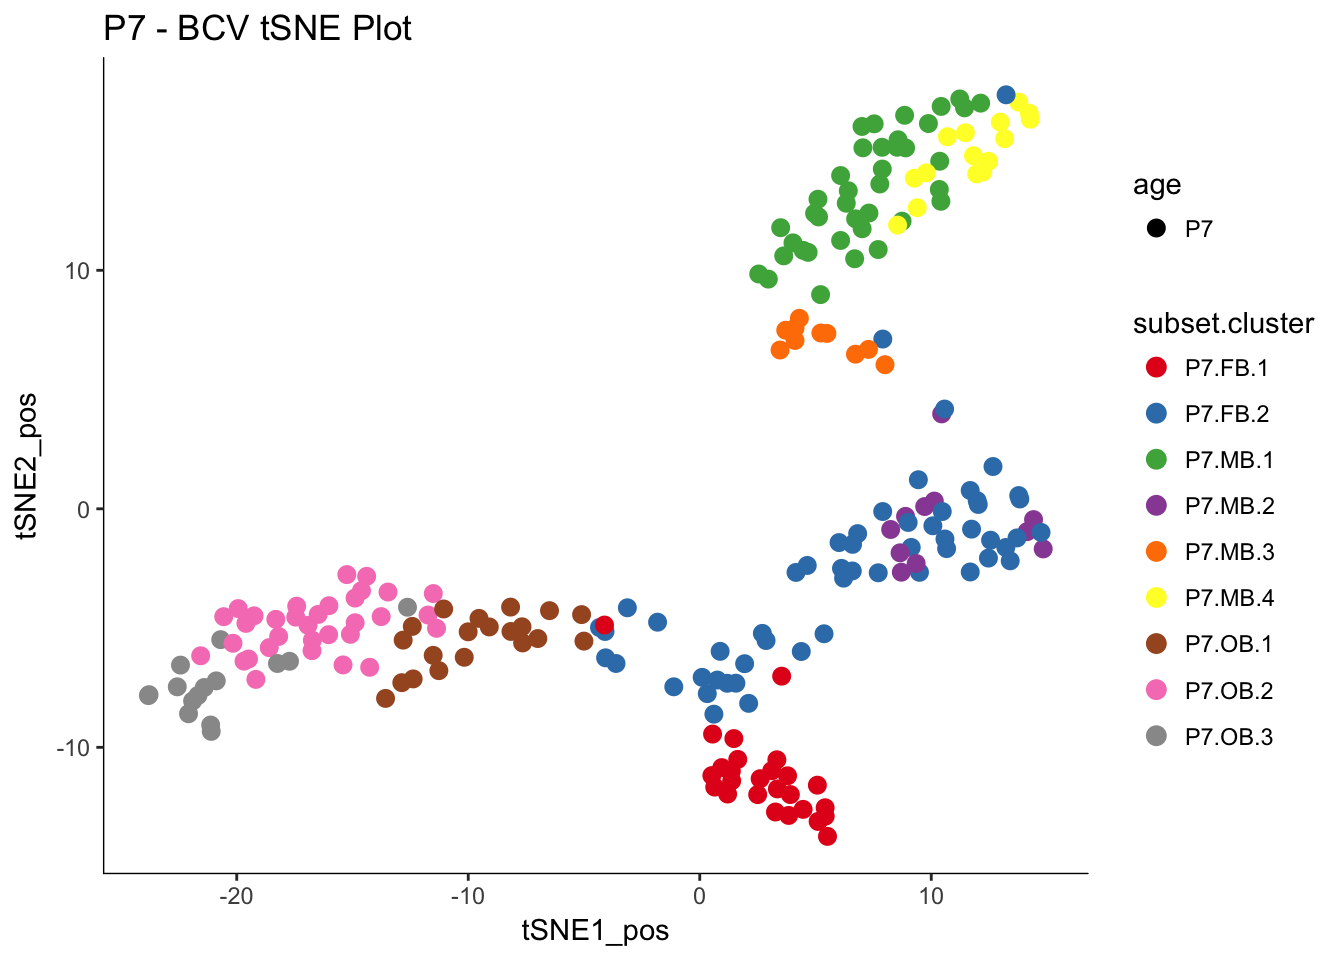
Saving the P7 final cds
P7.dat.filter.final <- P7.dat.filter
saveRDS(object = P7.dat.filter.final, file = file.path(Rdata_dir, "P7.dat.filter.final.Rds"))
Session Info
sessionInfo()## R version 3.3.0 (2016-05-03)
## Platform: x86_64-apple-darwin13.4.0 (64-bit)
## Running under: OS X 10.11.6 (El Capitan)
##
## locale:
## [1] en_US.UTF-8/en_US.UTF-8/en_US.UTF-8/C/en_US.UTF-8/en_US.UTF-8
##
## attached base packages:
## [1] grid splines stats4 parallel stats graphics grDevices
## [8] utils datasets methods base
##
## other attached packages:
## [1] ggbiplot_0.55 scales_0.5.0 SC3_1.1.4
## [4] ROCR_1.0-7 jackstraw_1.1.1 lfa_1.2.2
## [7] tsne_0.1-3 gridExtra_2.3 slackr_1.4.2
## [10] vegan_2.4-4 permute_0.9-4 MASS_7.3-47
## [13] gplots_3.0.1 RColorBrewer_1.1-2 Hmisc_4.0-3
## [16] Formula_1.2-2 survival_2.41-3 lattice_0.20-35
## [19] Heatplus_2.18.0 Rtsne_0.13 pheatmap_1.0.8
## [22] tidyr_0.7.1 dplyr_0.7.4 plyr_1.8.4
## [25] heatmap.plus_1.3 stringr_1.2.0 marray_1.50.0
## [28] limma_3.28.21 reshape2_1.4.3 monocle_2.2.0
## [31] DDRTree_0.1.5 irlba_2.2.1 VGAM_1.0-2
## [34] ggplot2_2.2.1 Biobase_2.32.0 BiocGenerics_0.18.0
## [37] Matrix_1.2-11
##
## loaded via a namespace (and not attached):
## [1] RSelenium_1.7.1 colorspace_1.3-2 class_7.3-14
## [4] rprojroot_1.2 htmlTable_1.9 corpcor_1.6.9
## [7] base64enc_0.1-3 mvtnorm_1.0-6 codetools_0.2-15
## [10] doParallel_1.0.11 robustbase_0.92-7 knitr_1.17
## [13] jsonlite_1.5 cluster_2.0.6 semver_0.2.0
## [16] shiny_1.0.5 rrcov_1.4-3 httr_1.3.1
## [19] backports_1.1.1 assertthat_0.2.0 lazyeval_0.2.1
## [22] formatR_1.5 acepack_1.4.1 htmltools_0.3.6
## [25] tools_3.3.0 bindrcpp_0.2 igraph_1.1.2
## [28] gtable_0.2.0 glue_1.1.1 binman_0.1.0
## [31] doRNG_1.6.6 Rcpp_0.12.14 slam_0.1-37
## [34] gdata_2.18.0 nlme_3.1-131 iterators_1.0.8
## [37] mime_0.5 rngtools_1.2.4 gtools_3.5.0
## [40] WriteXLS_4.0.0 XML_3.98-1.9 DEoptimR_1.0-8
## [43] yaml_2.1.15 pkgmaker_0.22 rpart_4.1-11
## [46] fastICA_1.2-1 latticeExtra_0.6-28 stringi_1.1.5
## [49] pcaPP_1.9-72 foreach_1.4.3 e1071_1.6-8
## [52] checkmate_1.8.4 caTools_1.17.1 rlang_0.1.6
## [55] pkgconfig_2.0.1 matrixStats_0.52.2 bitops_1.0-6
## [58] qlcMatrix_0.9.5 evaluate_0.10.1 purrr_0.2.4
## [61] bindr_0.1 labeling_0.3 htmlwidgets_0.9
## [64] magrittr_1.5 R6_2.2.2 combinat_0.0-8
## [67] wdman_0.2.2 foreign_0.8-69 mgcv_1.8-22
## [70] nnet_7.3-12 tibble_1.3.4 KernSmooth_2.23-15
## [73] rmarkdown_1.8 data.table_1.10.4 HSMMSingleCell_0.106.2
## [76] digest_0.6.12 xtable_1.8-2 httpuv_1.3.5
## [79] openssl_0.9.7 munsell_0.4.3 registry_0.3This R Markdown site was created with workflowr