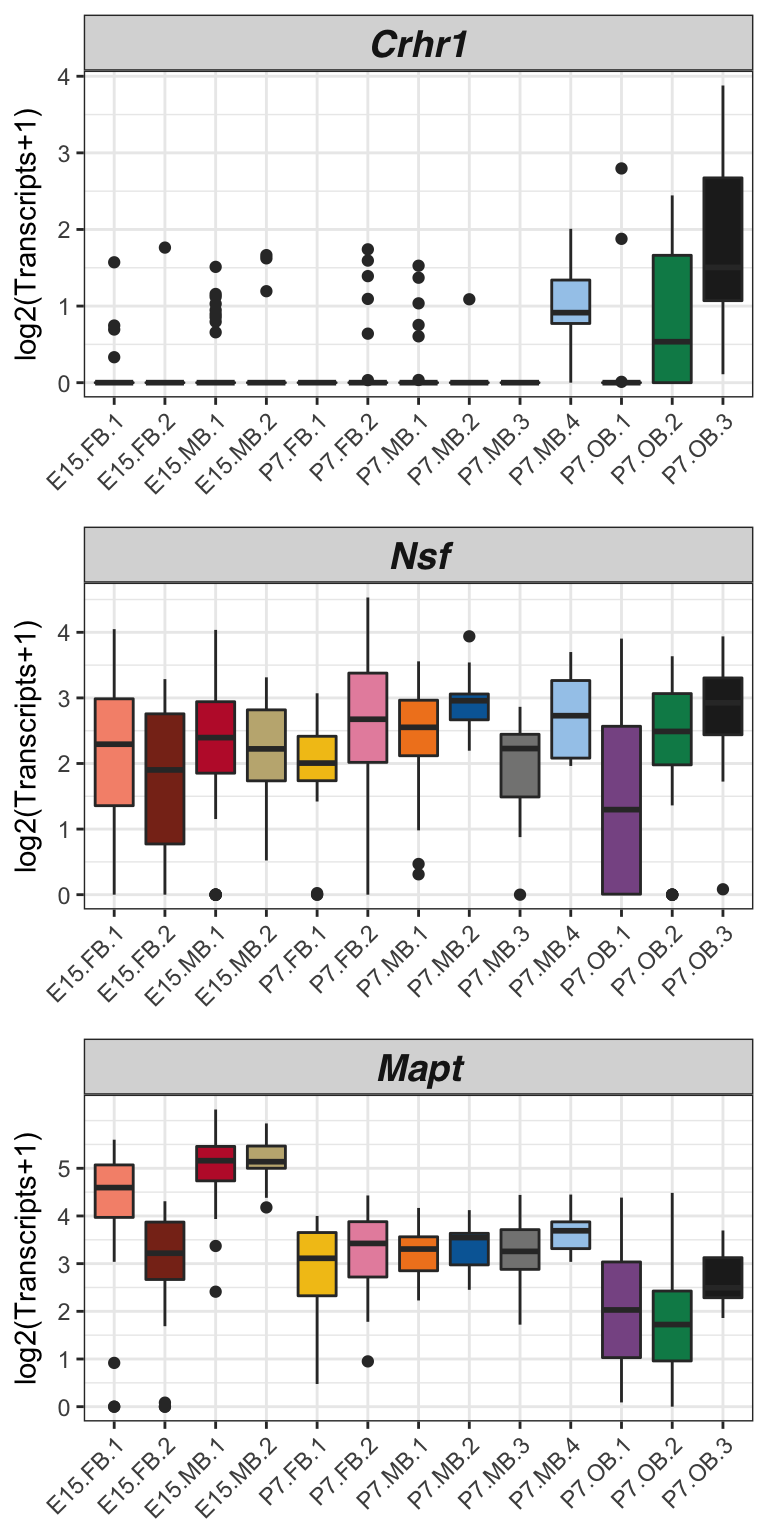
Figure 5C
Paul Hook
Last update: 2018-01-18
Code version: 5996c19850dc5fc65723f30bc33ab1c8d083a7e6
Setting important directories and loading important libraries and custom functions for analysis.
seq_dir <- "/Volumes/PAULHOOK/sc-da-parkinsons/data"
file_dir <- "/Volumes/PAULHOOK/sc-da-parkinsons/output"
Rdata_dir <- "/Volumes/PAULHOOK/sc-da-parkinsons/data"
Script_dir <- "/Volumes/PAULHOOK/sc-da-parkinsons/code"
figure_dir <- "/Volumes/PAULHOOK/sc-da-parkinsons/figures/"
source(file.path(Script_dir,'init.R'))
source(file.path(Script_dir,"tools_R.r"))

#loading special libraries
library(cowplot)
Loading the cds data needed to produce figure
dat.filter <- readRDS(file.path(Rdata_dir,"dat.filter.final.Rds"))Figure 5C
Below is code to make expression boxplots for genes in the MAPT locus.
color <- c("#F6937A","#882F1C","#BF1F36","#C2B280","#F2C318","#E790AC","#F18421","#0168A5","#848483","#A4CAEB","#885793","#008957","#222222")

crhr1 <- myBoxplot.subset(dat.filter, "Crhr1", logMode = T) + scale_fill_manual(values = color, name = "Subset Cluster") + scale_y_continuous(breaks = c(0,1,2,3,4,5))+
  theme(axis.title.x = element_blank(),
        axis.text.x = element_text(angle = 45, hjust = 1),
        legend.position = "none",
        strip.text = element_text(family="Helvetica",face="bold.italic",size=14))


mapt <- myBoxplot.subset(dat.filter, "Mapt", logMode = T) + scale_fill_manual(values = color, name = "Subset Cluster") + scale_y_continuous(breaks = c(0,1,2,3,4,5))+
  theme(axis.title.x = element_blank(),
        axis.text.x = element_text(angle = 45, hjust = 1),
        legend.position = "none",
        strip.text = element_text(family="Helvetica",face="bold.italic",size=14))

nsf <- myBoxplot.subset(dat.filter, "Nsf", logMode = T) + scale_fill_manual(values = color, name = "Subset Cluster") + scale_y_continuous(breaks = c(0,1,2,3,4,5))+
  theme(axis.title.x = element_blank(),
        axis.text.x = element_text(angle = 45, hjust = 1),
        legend.position = "none",
        strip.text = element_text(family="Helvetica",face="bold.italic",size=14))

pdf(file = file.path(file_dir, "Figure.5C.pdf"), width = 4, height = 2.5)
crhr1
mapt
nsf
dev.off()
## quartz_off_screen
## 2plot_grid(crhr1,nsf,mapt, ncol = 1)
This R Markdown site was created with workflowr