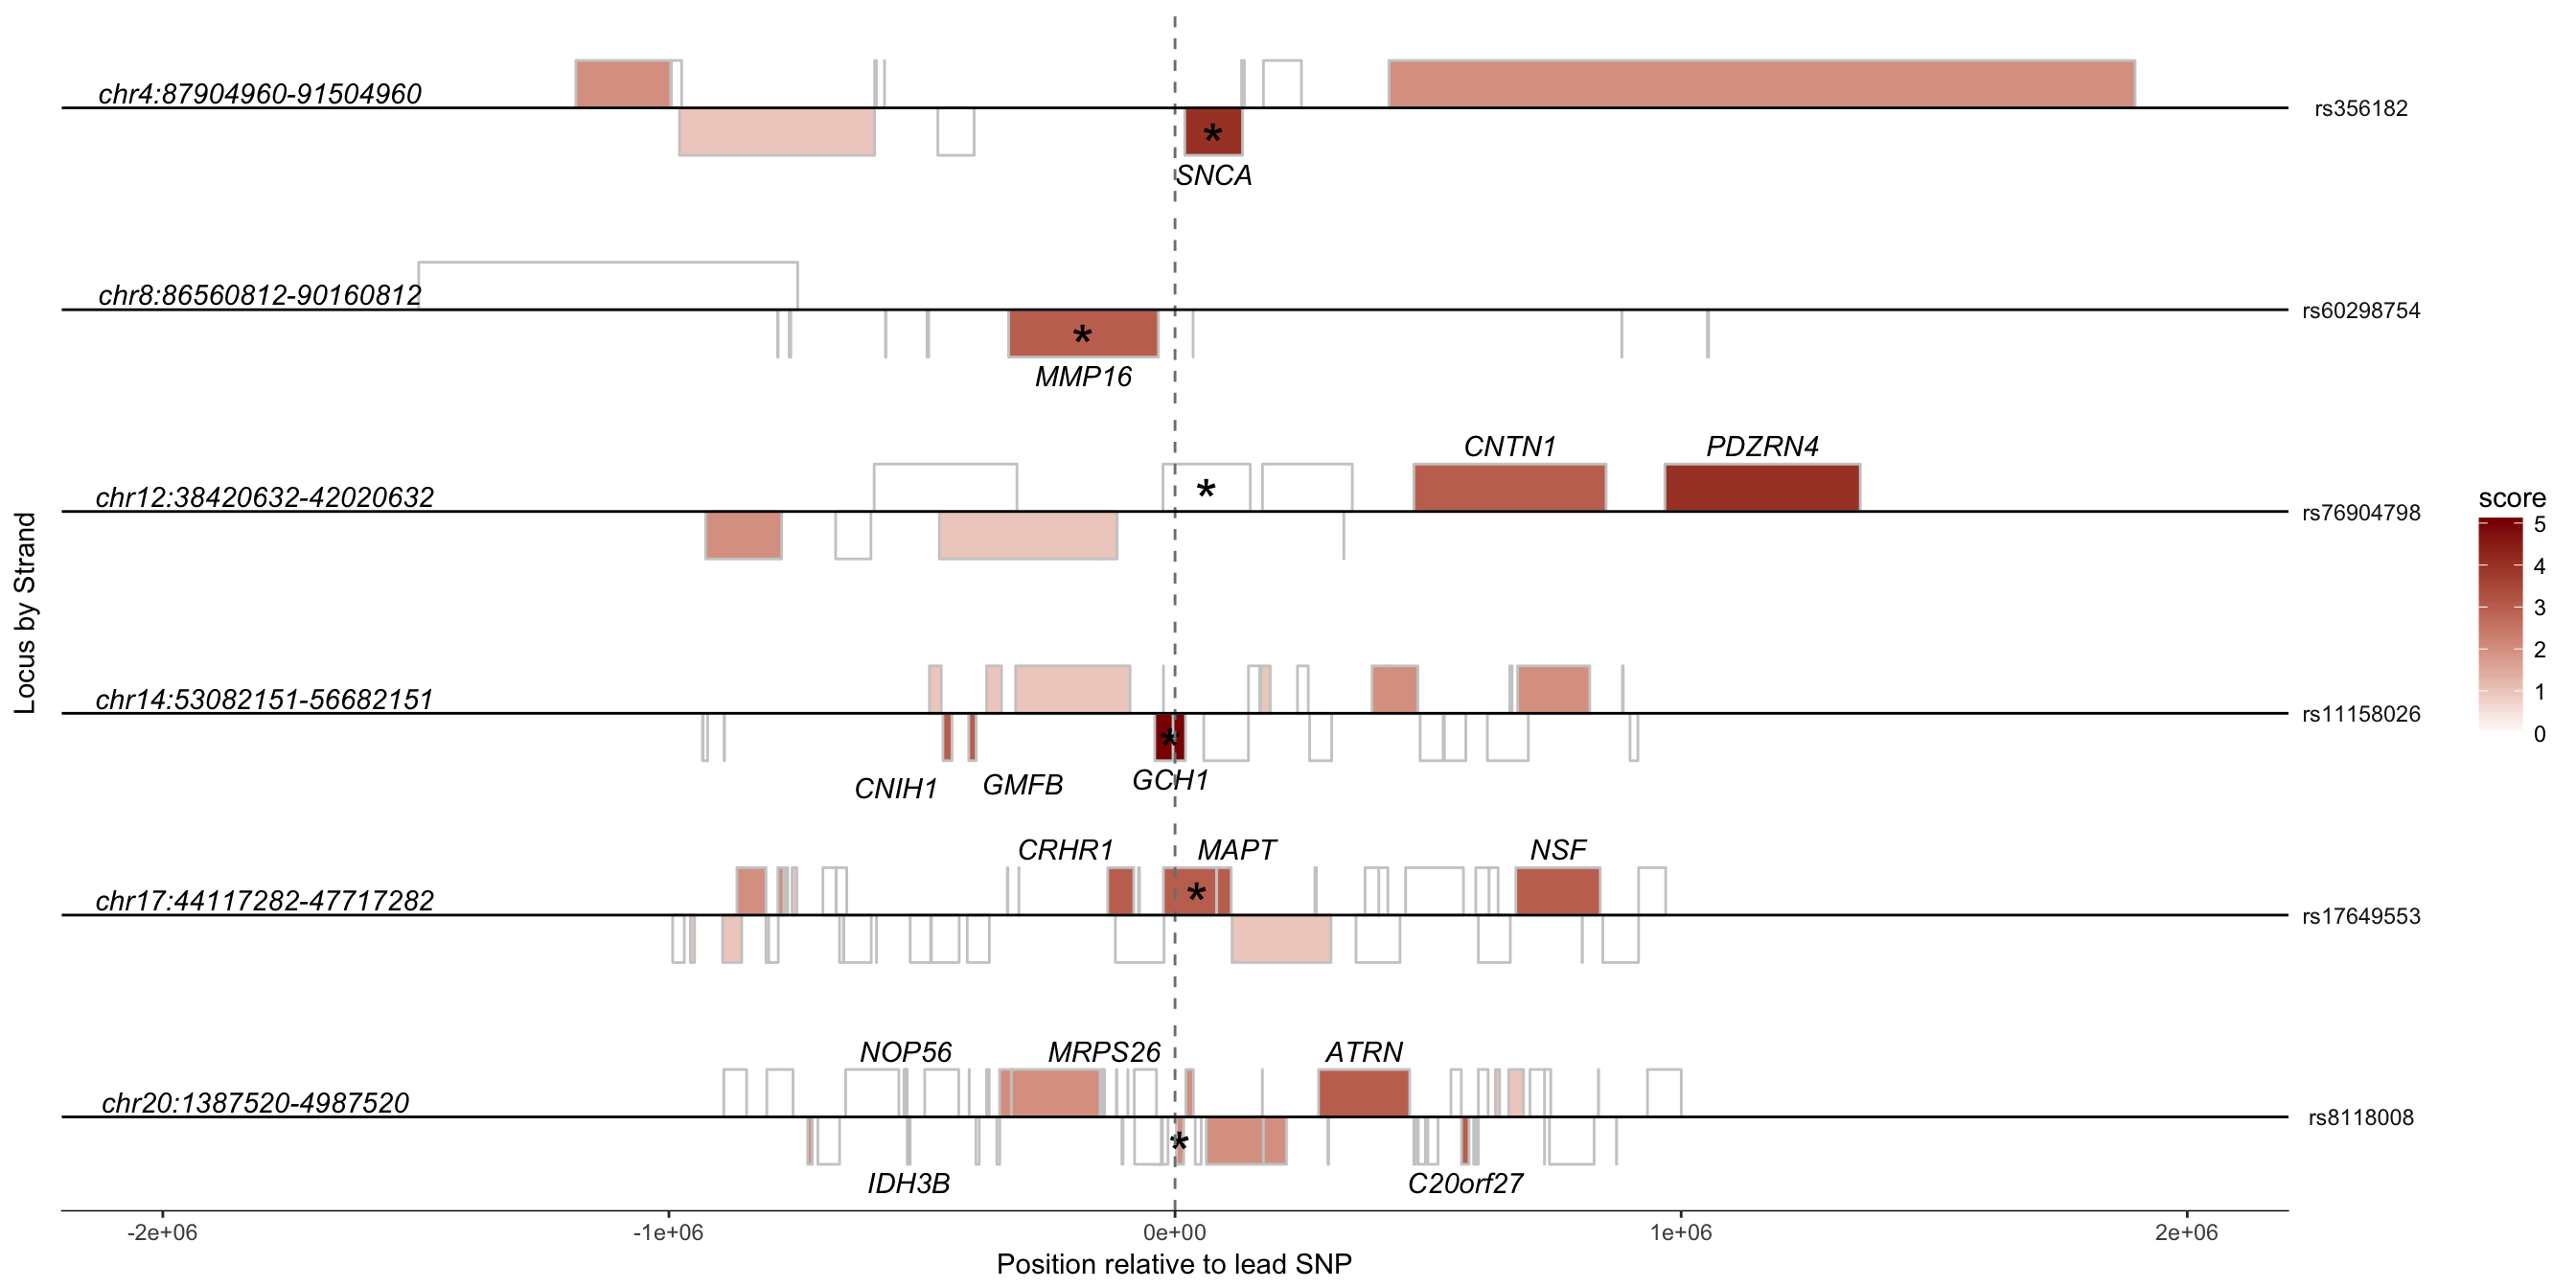
Figure 5A
Paul Hook
Last update: 2018-01-18
Code version: 5996c19850dc5fc65723f30bc33ab1c8d083a7e6
Setting important directories and loading important libraries and custom functions for analysis.
seq_dir <- "/Volumes/PAULHOOK/sc-da-parkinsons/data"
file_dir <- "/Volumes/PAULHOOK/sc-da-parkinsons/output"
Rdata_dir <- "/Volumes/PAULHOOK/sc-da-parkinsons/data"
Script_dir <- "/Volumes/PAULHOOK/sc-da-parkinsons/code"
figure_dir <- "/Volumes/PAULHOOK/sc-da-parkinsons/figures/"
source(file.path(Script_dir,'init.R'))
source(file.path(Script_dir,"tools_R.r"))

#loading special libraries
library(biomaRt)
library(ggrepel)
Loading data needed
First, we needed to load the dataframe in which we have the final scoring of PD GWAS genes
dat<-read.delim(file.path(file_dir,"PD.GWAS.Score.Final.txt"))Retrieving gene information from biomaRt
Below, we first extracted information about each gene that was scored in our analysis using biomaRt.
# Setting Ensembl mart
ensembl<-useEnsembl("ensembl", dataset = "hsapiens_gene_ensembl", version = 87)

# Extracting positional information about each gene
positions<-getBM(
  attributes=c('hgnc_symbol','chromosome_name','start_position','end_position','strand'),
  filters='hgnc_symbol',
  values=dat$HumanSymbol,
  mart=ensembl
)

# Removing entries from partial chromosomes
positions<-positions[!grepl("^CHR",positions$chromosome_name),]
Retrieving SNP information from biomaRt
Below, we first extracted information about each SNP that was included in our analysis using biomaRt.
#Setting mart
snpmart<-useEnsembl(biomart = "snp",dataset = 'hsapiens_snp', version = 87)

#Extracting spatial information
snpPos<-getBM(attributes = c('refsnp_id','chrom_start'),
      filters = c('snp_filter'),
      values = dat$snp,
      mart = snpmart)

#Removing duplicated entries
snpPos<-snpPos[!duplicated(snpPos$refsnp_id),]

#Merging gene positional information to the scoring DF
dat<-merge(dat,positions,by.x="HumanSymbol",by.y="hgnc_symbol")

#Merging SNP positional information to the scoring DF and renaming some columns
dat<-merge(dat,snpPos,by.x="snp",by.y="refsnp_id")
names(dat)[19]<-"snp_pos"
names(dat)[4] <- "human.locus"

#Marking a gene if the locus had previously been named for a gene
dat$causal<-NA
dat$causal[as.character(dat$human.locus)==as.character(dat$HumanSymbol)]<-"*"

# Calculating length
dat$length<-dat$end_position-dat$start_position

# Constructing coordinates
dat$locus<-paste("chr",dat$chromosome_name,":",dat$snp_pos-1.8e6,"-",dat$snp_pos+1.8e6,sep="")

# Making sure everything is factorized
dat$human.locus<-factor(dat$human.locus,levels=unique(dat$human.locus[order(as.numeric(dat$chromosome_name))]))
dat$snp<-factor(dat$snp,levels=unique(dat$snp[order(as.numeric(dat$chromosome_name))]))
Plotting selected loci
Now that we have all of our data set-up, we can plot representations of each locus.
#Loci to plot. All loci plotted had been previously associated with a gene.
select_loci<-c("MMP16","LRRK2","MAPT","SNCA","DDRGK1","GCH1")

# Plotting representations of each locus
p <- ggplot(subset(dat,human.locus %in% select_loci))
q <- p +
  geom_rect(aes(xmin=start_position-snp_pos,xmax=(start_position-snp_pos)+
                  length,ymin=0,ymax=0+strand,fill=score),color="grey80") +
  geom_text(aes(x=(start_position-snp_pos)+(length/2),y=strand/2,label=causal),size=8,vjust=0.8) +
  geom_text(aes(x=-2e6,y=0,label=locus),data=subset(unique(dat[,c("human.locus","locus","snp_pos","snp")]),human.locus %in% select_loci),vjust=-0.250,hjust=0.2,fontface="italic") +
  geom_text_repel(aes(x=(start_position-snp_pos)+(length/2),y=strand*1.8,label=HumanSymbol),color="black",data=subset(dat,human.locus %in% select_loci & score>=3), fontface = "italic") +
  geom_vline(xintercept=0,linetype="dashed",color="grey50") +
  geom_hline(yintercept=0,color="black") +
  facet_grid(snp~.,scales="free_x",space="free_x") +
  scale_fill_continuous(low="white",high="darkred") +
  scale_x_continuous(limits=c(-2e6,2e6)) +
  coord_equal(1) +
  monocle:::monocle_theme_opts() +
  theme(panel.grid.major = element_blank(),
        panel.grid.minor = element_blank(),
        axis.text.y=element_blank(),axis.line.y=element_blank(),
        axis.ticks.y=element_blank(),strip.text.y = element_text(angle = 0)) +
  xlab("Position relative to lead SNP") +
  ylab("Locus by Strand")

pdf(file = file.path(file_dir,"Figure.5A.pdf"),width=14,height=8)
q
dev.off()
## quartz_off_screen
## 2q
Session Info
sessionInfo()## R version 3.3.0 (2016-05-03)
## Platform: x86_64-apple-darwin13.4.0 (64-bit)
## Running under: OS X 10.11.6 (El Capitan)
##
## locale:
## [1] en_US.UTF-8/en_US.UTF-8/en_US.UTF-8/C/en_US.UTF-8/en_US.UTF-8
##
## attached base packages:
## [1] grid splines stats4 parallel stats graphics grDevices
## [8] utils datasets methods base
##
## other attached packages:
## [1] ggrepel_0.7.0 biomaRt_2.28.0 ggbiplot_0.55
## [4] scales_0.5.0 SC3_1.1.4 ROCR_1.0-7
## [7] jackstraw_1.1.1 lfa_1.2.2 tsne_0.1-3
## [10] gridExtra_2.3 slackr_1.4.2 vegan_2.4-4
## [13] permute_0.9-4 MASS_7.3-47 gplots_3.0.1
## [16] RColorBrewer_1.1-2 Hmisc_4.0-3 Formula_1.2-2
## [19] survival_2.41-3 lattice_0.20-35 Heatplus_2.18.0
## [22] Rtsne_0.13 pheatmap_1.0.8 tidyr_0.7.1
## [25] dplyr_0.7.4 plyr_1.8.4 heatmap.plus_1.3
## [28] stringr_1.2.0 marray_1.50.0 limma_3.28.21
## [31] reshape2_1.4.3 monocle_2.2.0 DDRTree_0.1.5
## [34] irlba_2.2.1 VGAM_1.0-2 ggplot2_2.2.1
## [37] Biobase_2.32.0 BiocGenerics_0.18.0 Matrix_1.2-11
##
## loaded via a namespace (and not attached):
## [1] RSelenium_1.7.1 colorspace_1.3-2 class_7.3-14
## [4] rprojroot_1.2 htmlTable_1.9 corpcor_1.6.9
## [7] base64enc_0.1-3 bit64_0.9-7 AnnotationDbi_1.34.4
## [10] mvtnorm_1.0-6 codetools_0.2-15 doParallel_1.0.11
## [13] robustbase_0.92-7 knitr_1.17 jsonlite_1.5
## [16] cluster_2.0.6 semver_0.2.0 shiny_1.0.5
## [19] rrcov_1.4-3 httr_1.3.1 backports_1.1.1
## [22] assertthat_0.2.0 lazyeval_0.2.1 acepack_1.4.1
## [25] htmltools_0.3.6 tools_3.3.0 bindrcpp_0.2
## [28] igraph_1.1.2 gtable_0.2.0 glue_1.1.1
## [31] binman_0.1.0 doRNG_1.6.6 Rcpp_0.12.14
## [34] slam_0.1-37 gdata_2.18.0 nlme_3.1-131
## [37] iterators_1.0.8 mime_0.5 rngtools_1.2.4
## [40] gtools_3.5.0 WriteXLS_4.0.0 XML_3.98-1.9
## [43] DEoptimR_1.0-8 yaml_2.1.15 memoise_1.1.0
## [46] pkgmaker_0.22 rpart_4.1-11 RSQLite_2.0
## [49] fastICA_1.2-1 latticeExtra_0.6-28 stringi_1.1.5
## [52] S4Vectors_0.10.3 pcaPP_1.9-72 foreach_1.4.3
## [55] e1071_1.6-8 checkmate_1.8.4 caTools_1.17.1
## [58] rlang_0.1.6 pkgconfig_2.0.1 matrixStats_0.52.2
## [61] bitops_1.0-6 qlcMatrix_0.9.5 evaluate_0.10.1
## [64] purrr_0.2.4 bindr_0.1 labeling_0.3
## [67] htmlwidgets_0.9 bit_1.1-12 magrittr_1.5
## [70] R6_2.2.2 IRanges_2.6.1 combinat_0.0-8
## [73] DBI_0.7 wdman_0.2.2 foreign_0.8-69
## [76] mgcv_1.8-22 RCurl_1.95-4.9 nnet_7.3-12
## [79] tibble_1.3.4 KernSmooth_2.23-15 rmarkdown_1.8
## [82] data.table_1.10.4 blob_1.1.0 HSMMSingleCell_0.106.2
## [85] digest_0.6.12 xtable_1.8-2 httpuv_1.3.5
## [88] openssl_0.9.7 munsell_0.4.3 registry_0.3This R Markdown site was created with workflowr