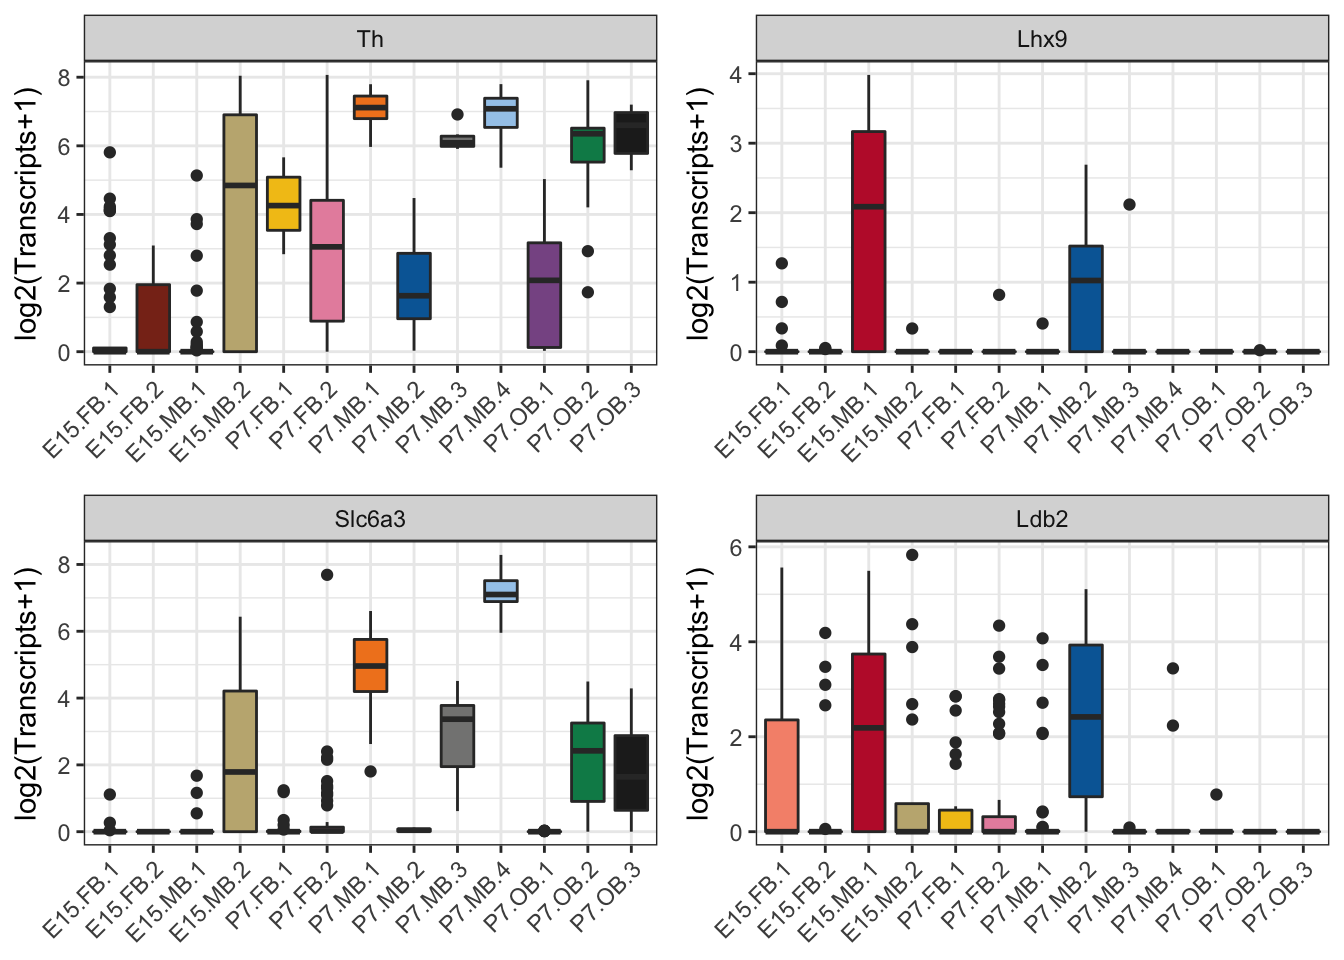
Figure 3
Paul Hook
Last update: 2018-01-18
Code version: 5996c19850dc5fc65723f30bc33ab1c8d083a7e6
Setting important directories. Also loading important libraries and custom functions for analysis.
seq_dir <- "/Volumes/PAULHOOK/sc-da-parkinsons/data"
file_dir <- "/Volumes/PAULHOOK/sc-da-parkinsons/output"
Rdata_dir <- "/Volumes/PAULHOOK/sc-da-parkinsons/data"
Script_dir <- "/Volumes/PAULHOOK/sc-da-parkinsons/code"
figure_dir <- "/Volumes/PAULHOOK/sc-da-parkinsons/figures/"
source(file.path(Script_dir,'init.R'))
source(file.path(Script_dir,"tools_R.r"))

#loading special libraries
library(cowplot)
Loading the cds data needed to produce figures
dat.filter <- readRDS(file.path(Rdata_dir,"dat.filter.final.Rds"))Figure 3A
Below is code to make expression boxplots identified as important for the identification of the P7 neuroblast population and as well as the single molecule in situs displayed in the rest of Figure 3.
# Setting the colors to follow the rest of the figures
color <- c("#F6937A","#882F1C","#BF1F36","#C2B280","#F2C318","#E790AC","#F18421","#0168A5","#848483","#A4CAEB","#885793","#008957","#222222")

# Lhx9 boxplot
lhx9 <- myBoxplot.subset(dat.filter, markers = "Lhx9", logMode = T) + scale_fill_manual(values = color, name = "Subset Cluster") +
  theme(axis.title.x = element_blank(),
        axis.text.x = element_text(angle = 45, hjust = 1),
        legend.position = "none")

# Ldb2 boxplot
ldb2 <- myBoxplot.subset(dat.filter, markers = "Ldb2", logMode = T) + scale_fill_manual(values = color, name = "Subset Cluster") +
  theme(axis.title.x = element_blank(),
        axis.text.x = element_text(angle = 45, hjust = 1),
        legend.position = "none")

#Th boxplot
th <- myBoxplot.subset(dat.filter, markers = "Th", logMode = T) + scale_fill_manual(values = color, name = "Subset Cluster") +
  theme(axis.title.x = element_blank(),
        axis.text.x = element_text(angle = 45, hjust = 1),
        legend.position = "none")

#Slc6a3 boxplot
slc6a3 <- myBoxplot.subset(dat.filter, markers = "Slc6a3", logMode = T) + scale_fill_manual(values = color, name = "Subset Cluster") +
  theme(axis.title.x = element_blank(),
        axis.text.x = element_text(angle = 45, hjust = 1),
        legend.position = "none")

#Write out plots
pdf(file = file.path(figure_dir,"Figure.3A.pdf"), height = 3, width = 6)
lhx9
ldb2
th
slc6a3
dev.off()
## quartz_off_screen
## 2plot_grid(th, lhx9, slc6a3, ldb2, ncol = 2)
Session Info
sessionInfo()## R version 3.3.0 (2016-05-03)
## Platform: x86_64-apple-darwin13.4.0 (64-bit)
## Running under: OS X 10.11.6 (El Capitan)
##
## locale:
## [1] en_US.UTF-8/en_US.UTF-8/en_US.UTF-8/C/en_US.UTF-8/en_US.UTF-8
##
## attached base packages:
## [1] grid splines stats4 parallel stats graphics grDevices
## [8] utils datasets methods base
##
## other attached packages:
## [1] cowplot_0.9.2 ggbiplot_0.55 scales_0.5.0
## [4] SC3_1.1.4 ROCR_1.0-7 jackstraw_1.1.1
## [7] lfa_1.2.2 tsne_0.1-3 gridExtra_2.3
## [10] slackr_1.4.2 vegan_2.4-4 permute_0.9-4
## [13] MASS_7.3-47 gplots_3.0.1 RColorBrewer_1.1-2
## [16] Hmisc_4.0-3 Formula_1.2-2 survival_2.41-3
## [19] lattice_0.20-35 Heatplus_2.18.0 Rtsne_0.13
## [22] pheatmap_1.0.8 tidyr_0.7.1 dplyr_0.7.4
## [25] plyr_1.8.4 heatmap.plus_1.3 stringr_1.2.0
## [28] marray_1.50.0 limma_3.28.21 reshape2_1.4.3
## [31] monocle_2.2.0 DDRTree_0.1.5 irlba_2.2.1
## [34] VGAM_1.0-2 ggplot2_2.2.1 Biobase_2.32.0
## [37] BiocGenerics_0.18.0 Matrix_1.2-11
##
## loaded via a namespace (and not attached):
## [1] RSelenium_1.7.1 colorspace_1.3-2 class_7.3-14
## [4] rprojroot_1.2 htmlTable_1.9 corpcor_1.6.9
## [7] base64enc_0.1-3 mvtnorm_1.0-6 codetools_0.2-15
## [10] doParallel_1.0.11 robustbase_0.92-7 knitr_1.17
## [13] jsonlite_1.5 cluster_2.0.6 semver_0.2.0
## [16] shiny_1.0.5 rrcov_1.4-3 httr_1.3.1
## [19] backports_1.1.1 assertthat_0.2.0 lazyeval_0.2.1
## [22] acepack_1.4.1 htmltools_0.3.6 tools_3.3.0
## [25] bindrcpp_0.2 igraph_1.1.2 gtable_0.2.0
## [28] glue_1.1.1 binman_0.1.0 doRNG_1.6.6
## [31] Rcpp_0.12.14 slam_0.1-37 gdata_2.18.0
## [34] nlme_3.1-131 iterators_1.0.8 mime_0.5
## [37] rngtools_1.2.4 gtools_3.5.0 WriteXLS_4.0.0
## [40] XML_3.98-1.9 DEoptimR_1.0-8 yaml_2.1.15
## [43] pkgmaker_0.22 rpart_4.1-11 fastICA_1.2-1
## [46] latticeExtra_0.6-28 stringi_1.1.5 pcaPP_1.9-72
## [49] foreach_1.4.3 e1071_1.6-8 checkmate_1.8.4
## [52] caTools_1.17.1 rlang_0.1.6 pkgconfig_2.0.1
## [55] matrixStats_0.52.2 bitops_1.0-6 qlcMatrix_0.9.5
## [58] evaluate_0.10.1 purrr_0.2.4 bindr_0.1
## [61] labeling_0.3 htmlwidgets_0.9 magrittr_1.5
## [64] R6_2.2.2 combinat_0.0-8 wdman_0.2.2
## [67] foreign_0.8-69 mgcv_1.8-22 nnet_7.3-12
## [70] tibble_1.3.4 KernSmooth_2.23-15 rmarkdown_1.8
## [73] data.table_1.10.4 HSMMSingleCell_0.106.2 digest_0.6.12
## [76] xtable_1.8-2 httpuv_1.3.5 openssl_0.9.7
## [79] munsell_0.4.3 registry_0.3This R Markdown site was created with workflowr